CGG: Announces its 2020 Third Quarter Results

CGG, a world leader in Geoscience, announced today its 2020 third quarter unaudited results.
Commenting on these results, Sophie Zurquiyah, CGG CEO, said:
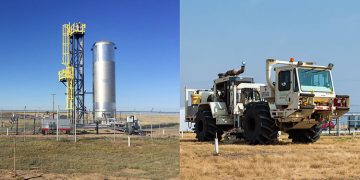
““CGG markets stabilized in Q3 as large Independents and NOCs started to resume activity, mainly in their core areas. We are on track with the implementation of the cost reduction plan resulting in increased Adjusted EBITDAs. Our high-end technology significantly improves our clients’ understanding of the subsurface and provides important insights to the prioritization of their energy investments. This, combined with our focus on mature basins and the technology vital for step-out exploration, development and production, provides CGG with a unique value proposition for our clients. We have been able to maintain market share in our core businesses throughout the year, and I have been pleased with our progress towards developing offerings in adjacent fields, including structural health monitoring, CCUS, geothermal and environmental geosciences. “
| Q3 2020: stable Revenue and increased Adjusted EBITDAs quarter-on-quarter
§ IFRS figures: revenue at $178m, OPINC at $(43)m, Group net loss at $(93)m
§ Segment revenue at $199m, stable quarter-on-quarter . Geoscience: Resilient activity of large and dedicated imaging centers . Multi-client: Increased sales driven by higher after-sales . Equipment: Lower land activity and delays in deliveries
§ Segment EBITDAs at $52m and Adjusted* Segment EBITDAs at $80m before $(28)m of non-recurring severance costs, up 6% quarter-on-quarter, a 40% margin
§ Segment Operating Income at $(38)m and Adjusted* Segment Operating Income at $(4)m before $(34)m of non-recurring charges
*Adjusted indicators represent supplementary information adjusted for non-recurring charges triggered by economic downturn.
Liquidity of $465m at the end of September 2020
§ Q3 2020 negative change in working capital of $(37)m supporting increased Q4 sales § Q3 2020 non-recurring cash costs of $(26)m, including $(7)m severance and $(19)m of CGG 2021 plan costs § Q3 2020 Segment Free Cash Flow at $(59)m, including high negative change in working capital. Net Cash Flow of $(92)m § Liquidity of $465m and Net debt before IFRS 16 of $749m at September 30, 2020
Confirming 2020 Cash Capex and 2020 cost reduction measures**
§ 2020 Cash Capex around $300 million: ü 2020 Multi-client cash capex confirmed at around $225 million and around 75% prefunding rate ü 2020 Industrial and development costs cash capex around $75 million § All saving plans (2021 plan and Covid-19) expected to generate cash costs reductions of around $35m in 2020 and around $135m annualized, including around $90m of fixed cash costs § Covid-19 plan total expenses of around $(50)m, with P&L impact of $(44)m in 2020 and $(6)m$ in 2021 and cash-out sequence of $(15)m in 2020 and $(35)m in 2021 **As mentioned on May 12, 2020, capex and cost reductions are the only two metrics for 2020 guidance provided by the company in current crisis environment
Sercel and Shearwater agreed to suspend negotiations on marine streamer JV
Due to the downturn in the oil & gas industry, triggered by the COVID-19 pandemic, CGG and Shearwater have jointly agreed to suspend negotiations around creating a marine streamer equipment JV until visibility in the streamer replacement cycle improves. Both parties continue to benefit from the marine acquisition partnership and remain committed to the establishment of its technology component to further their mutually beneficial cooperation. |
Key Figures – Third Quarter 2020
| Key Figures IFRS – Quarter In million $ |
2020 Q2 |
2020 Q3 |
Variances % |
| Operating revenues | 239 | 178 | (26)% |
| Operating Income | (32) | (43) | (32)% |
| Equity from Investment | 0 | 0 | – |
| Net cost of financial debt | (33) | (34) | 4% |
| Other financial income (loss) | (36) | (12) | (67)% |
| Income taxes | (33) | 1 | 103% |
| Net Income / Loss from continuing operations | (134) | (88) | 34% |
| Net Income / Loss from discontinued operations | (13) | (5) | 62% |
| Group net income / (loss) | (147) | (93) | 37% |
| Operating Cash Flow | 81 | 12 | (85)% |
| Net Cash Flow | (77) | (92) | (20)% |
| Net debt | 783 | 910 | 16% |
| Net debt before lease | 626 | 749 | 20% |
| Capital employed | 2,129 | 2,172 | 2% |
Key Segment Figures – Third Quarter 2020
| Key Segment Figures – Quarter In million $ |
2020 Q2 |
2020 Q3 |
Variances % |
| Segment revenue | 202 | 199 | (1)% |
| Segment EBITDAs | 68 | 52 | (24)% |
| Group EBITDAs margin | 34% | 26% | (77) bps |
| Segment operating income | (53) | (38) | 29% |
| Opinc margin | (26)% | (19)% | 75 bps |
| IFRS 15 adjustment | 21 | (5) | (123)% |
| IFRS operating income | (32) | (43) | (32)% |
| Operating Cash Flow | 81 | 12 | (85)% |
| Net Segment Cash Flow | (77) | (92) | (20)% |
| Supplementary information | |||
| Adjusted segment EBITDAs before NRC | 76 | 80 | 6% |
| EBITDAs margin | 37% | 40% | 29 bps |
| Adjusted segment operating income before NRC | (5) | (4) | 15% |
| Opinc margin | (2)% | (2)% | 3 bps |
Key Figures – 9 Months 2020
| Key Figures IFRS – YTD In million $ |
2019 Sept YTD |
2020 Sept YTD |
Variances % |
| Operating revenues | 930 | 669 | (28)% |
| Operating Income | 169 | (115) | – |
| Equity from Investment | 0 | 0 | – |
| Net cost of financial debt | (98) | (100) | (1)% |
| Other financial income (loss) | 4 | (42) | – |
| Income taxes | (11) | (37) | – |
| Net Income / Loss from continuing operations | 63 | (293) | – |
| Net Income / Loss from discontinued operations | (151) | (45) | 70% |
| Group net income / (loss) | (87) | (338) | – |
| Operating Cash Flow | 572 | 238 | (58)% |
| Net Cash Flow | 179 | (152) | – |
| Net debt | 732 | 910 | 24% |
| Net debt before leases | 544 | 749 | 38% |
| Capital employed | 2,312 | 2,172 | (6)% |
Key Segment Figures – 9 Months 2020
| Key Segment Figures – YTD In million $ |
2019 Sept YTD |
2020 Sept YTD |
Variances % |
| Segment revenue | 1,004 | 672 | (33)% |
| Segment EBITDAs | 515 | 243 | (53)% |
| Group EBITDAs margin | 51% | 36% | (152) bps |
| Segment operating income | 175 | (122) | – |
| Opinc margin | 17% | (18)% | (356) bps |
| IFRS 15 adjustment | (6) | 7 | – |
| IFRS operating income | 169 | (115) | – |
| Operating Cash Flow | 572 | 238 | (58)% |
| Net Segment Cash Flow | 179 | (152) | – |
| Supplementary information | |||
| Adjusted segment EBITDAs before NRC | 515 | 281 | (46)% |
| Group EBITDAs margin | 51% | 42% | (96) bps |
| Adjusted segment operating income before NRC | 175 | 32 | (82)% |
| Opinc margin | 17% | 5% | (127) bps |
Key figures bridge: Segment to IFRS – Third Quarter 2020
| P&L items – Q3 In million $ |
Segment figures | IFRS 15 adjustment | IFRS figures |
| Total Revenue | 199 | (22) | 178 |
| OPINC | (38) | (5) | (43) |
| Cash Flow Statement items – Q3 In million $ |
Segment figures | IFRS 15 adjustment | IFRS figures |
| EBITDAs | 52 | (22) | 30 |
| Change in Working Capital & Provisions | (37) | 22 | (16) |
| Cash Provided by Operations | 12 | (0) | 12 |
| Multi-Client Data Library NBV In million $ |
Segment figures | IFRS 15 adjustment | IFRS figures |
| Opening Balance Sheet, Mar 20 | 340 | 140 | 480 |
| Closing Balance Sheet, Sept 20 | 345 | 154 | 499 |
Key figures bridge: Segment to IFRS – 9 Months 2020
| P&L items – YTD In million $ |
Segment figures | IFRS 15 adjustment | IFRS figures |
| Total Revenue | 672 | (3) | 669 |
| OPINC | (122) | 7 | (115) |
| Cash Flow Statement items – YTD In million $ |
Segment figures | IFRS 15 adjustment | IFRS figures |
| EBITDAs | 243 | (3) | 240 |
| Change in Working Capital & Provisions | (1) | 3 | 2 |
| Cash Provided by Operations | 238 | (0) | 238 |
| Multi-Client Data Library NBV In million $ |
Segment figures | IFRS 15 adjustment | IFRS figures |
| Opening Balance Sheet , Dec 19 | 376 | 155 | 531 |
| Closing Balance Sheet , Sep 20 | 345 | 154 | 499 |
Third Quarter 2020 Segment Financial Results
Geology, Geophysics & Reservoir (GGR)
| Geology, Geophysics & Reservoir (GGR) In million $ |
2020 Q2 |
2020 Q3 |
Variances, % |
| Segment revenue | 144 | 150 | 4% |
| Geoscience | 83 | 77 | (7)% |
| Multi-Client | 62 | 73 | 18% |
| Prefunding | 46 | 39 | (15)% |
| After-Sales | 15 | 34 | 120% |
| Segment EBITDAs | 74 | 56 | (24)% |
| EBITDAs Margin | 51% | 38% | (137) bps |
| Segment operating income | (39) | (25) | 37% |
| OPINC Margin | (27)% | (16)% | 106 bps |
| Equity from investments | 0 | 0 | – |
| Capital employed (in billion $) | 1.7 | 1.7 | 1% |
| Supplementary information | |||
| Adjusted segment EBITDAs before NRC | 81 | 85 | 6% |
| EBITDAs Margin | 56% | 57% | 10 bps |
| Adjusted segment OPINC before NRC | 9 | 10 | 7% |
| OPINC Margin | 6% | 7% | 2 bps |
| Other Key Metrics | |||
| Multi-Client cash capex ($m) | (73) | (58) | (20)% |
| Multi-Client cash prefunding rate (%) | 63% | 68% | 43 bps |
GGR segment revenue was $150 million, up 4% quarter-on-quarter.
- Geoscience revenue was $77 million, down (7)% quarter-on-quarter.
Despite the general slowdown of the economy and its effect on clients’ E&P spending, Geoscience activity remained resilient, down sequentially (7)% driven by sustained activity in the main large imaging centers, GeoSoftware and our dedicated processing centers.
Geoscience is adapting to lower demand as Q3 total production was down only (2)% sequentially.
Preservation of business continuity and profitability remains the focus. CGG’s Geoscience leading technology continues to be recognized by major clients. GeoSoftware continued to delivered innovation this quarter with new reservoir characterization cloud technology, and Smart Data Solutions business won significant data management contracts.
- Multi-Client revenue was $73 million this quarter, up 18% quarter-on-quarter.
- Prefunding revenue of our multi-client projects was $39 million, down (15)% quarter-on-quarter as multi-client cash capex was (20)% lower at $(58)m in Q3. Prefunding rate was 68%.
We had four multi-client programs this quarter: three marine streamer surveys – Nebula in Brazil, Gippsland – in Australia and North Viking Graben in Norway, and one ocean bottom nodes survey in the UK North Sea.
- Multi-client after-sales were at $34 million this quarter driven by Brazil and US Gulf of Mexico, up 120% quarter-on-quarter.
The segment library Net Book Value was $345 million ($499 million after IFRS 15 adjustments) at the end of September 2020, split 86% offshore and 14% onshore.
GGR segment EBITDAs was $56 million, with 38% margin.
GGR Adjusted segment EBITDAs $85 million with 57% margin before $(28) million of COVID-19 plan costs.
GGR segment operating income was $(25) million.
GGR Adjusted segment operating income was $10 million with 6% margin before $(35) million of non-recurring charges.
GGR capital employed was stable at $1.7 billion at the end of September 2020.
Equipment
| Equipment In million $ |
2020 Q2 |
2020 Q3 |
Variances, % |
| Segment revenue | 58 | 50 | (14)% |
| Land | 45 | 31 | (30)% |
| Marine | 10 | 15 | 52% |
| Downhole gauges | 3 | 2 | (28)% |
| Non Oil & Gas | 1 | 3 | 92% |
| Segment EBITDAs | 0 | (1) | – |
| EBITDAs margin | 0% | (1)% | (18) bps |
| Segment operating income | (7) | (9) | (27)% |
| OPINC Margin | (12)% | (18)% | (51) bps |
| Capital employed (in billion $) | 0.5 | 0.6 | 5% |
| Supplementary information | |||
| Adjusted segment EBITDAs before NRC | 1 | 0 | – |
| EBITDAs margin | 2% | 0% | (25) bps |
| Adjusted segment OPINC before NRC | (6) | (9) | (38)% |
| OPINC Margin | (11)% | (17)% | (58) bps |
Equipment segment revenue was $50 million, down 14% quarter-on-quarter. External sales were $50 million.
- Land equipment sales represented 62% of total sales, as we delivered in Q3 over 50 thousand 508XT channels mainly in Russia and India. Sercel also delivered its first land node WiNG system in North America.
- Marine equipment sales represented 29% of total sales driven by spares sections sales of Sentinel streamers’ installed base.
- Downhole equipment sales were $2 million and sales from non Oil & Gas equipment were $3 million
Equipment segment EBITDAs was $(1) million.
Equipment Adjusted segment EBITDAs was $0m before $(1) million of COVID-19 plan costs.
Equipment segment operating income was $(9) million.
Equipment Adjusted segment operating income $(9) million before $(0.5) million of non-recurring charges.
Equipment capital employed was up at $0.6 billion at the end of September 2020.
Third Quarter 2020 Financial Results
| Consolidated Income Statements In million $ |
2020 Q2 |
2020 Q3 |
Variances % |
| Exchange rate euro/dollar | 1.10 | 1.17 | 6% |
| Segment revenue | 202 | 199 | (1)% |
| GGR | 144 | 150 | 4% |
| Equipment | 58 | 50 | (14)% |
| Elim & Other | (1) | (1) | 7% |
| Segment Gross Margin | 24 | 27 | 13% |
| Segment EBITDAs | 68 | 52 | (24)% |
| GGR | 81 | 85 | 6% |
| Equipment | 1 | 0 | – |
| Corporate | (6) | (5) | 7% |
| Elim & Other | 0 | 1 | – |
| COVID-19 plan | (7) | (28) | – |
| Segment operating income | (53) | (38) | 29% |
| GGR | 9 | 10 | 7% |
| Equipment | (6) | (9) | (38)% |
| Corporate | (7) | (6) | 8% |
| Elim & Other | (1) | 1 | – |
| Non recurring charges | (49) | (34) | 31% |
| IFRS 15 adjustment | 21 | (5) | – |
| IFRS operating income | (32) | (43) | (32)% |
| Equity from investments | 0 | 0 | – |
| Net cost of financial debt | (33) | (34) | (4)% |
| Other financial income (loss) | 1 | (4) | – |
| Income taxes | (24) | 1 | 104% |
| NRC (Tax & OFI) | (46) | (8) | 83% |
| Net income / (loss) from continuing operations | (134) | (88) | 34% |
| Net income / (loss) from discontinued operations | (13) | (5) | 62% |
| IFRS net income / (loss) | (147) | (93) | 37% |
| Shareholder’s net income / (loss) | (147) | (93) | 37% |
| Basic Earnings per share in $ | (0.21) | (0.13) | 37% |
| Basic Earnings per share in € | (0.19) | (0.11) | 40% |
Segment revenue was $199 million, stable quarter-on-quarter. The respective contributions from the Group’s businesses were 38% from Geoscience, 37% from Multi-Client (75% for the GGR segment) and 25% from Equipment.
Segment EBITDAs was $52 million and Adjusted* segment EBITDAs was $80 million before $(28) million of Covid-19 plan costs, up 6% sequentially, a 40% margin.
Segment operating income was $(38) million and Adjusted* segment operating income was $(4) million before $(34) million of non-recurring charges.
IFRS 15 adjustment at operating income level was $(5) million and IFRS operating income, after IFRS 15 adjustment, was $(43) million.
Cost of financial debt was $(34) million. The total amount of interest paid during the quarter was $(7) million.
Other Financial Items were $(12) million including $(8) million of non-recurring charges related to remeasurement of fair value of other financial assets and liabilities.
Taxes were at $1 million.
Net loss from continuing operations was $(88) million.
| Discontinued operations
Correspond to the former Contractual Data Acquisition and Non-Operated Resources segments. Main aggregates are as follows: – Q3 revenue from discontinued operations was $6 million. – Net loss from discontinued operations was $(5) million this quarter. – Net Cash flow from discontinued operations was $7 million before Plan 2021 |
Group net loss was $(93) million.
After minority interests, Group net loss attributable to CGG shareholders was $(93) million/ €(79) million.
Adjusted Net loss from continuing operations, excluding $(41) million of non-recurring charges, was $(47) million.
Global economic crisis, triggered by Covid-19 pandemic and unprecedented drop in oil price and E&P spending lead CGG to launch cost reduction actions («Covid-19 plan») and recognize other non-recurring charges. $(41) million of non-recurring charges were booked during the third quarter of 2020:
- $(28) million of severance costs
- $(6) million of non-cash fair value remeasurement of assets available for sale
- $(8) million of non-cash remeasurement of other financial assets and liabilities mainly related to Marine Acquisition exit transaction
| Non-recurring charges (in m$) | Q3 2020 |
| Operational costs provisions | (28) |
| Multi-client library Impairment | |
| Asset impairment | (6) |
| Goodwill impairment | |
| Other Financial Items (OFI) adjustment | (8) |
| Deferred Tax Assets impairment | |
| Total | (41) |
Third Quarter 2020 Cash Flow
| Cash Flow items In million $ |
2020 Q2 |
2020 Q3 |
Variances % |
| Segment Operating Cash Flow | 81 | 12 | (85)% |
| CAPEX | (89) | (71) | (20)% |
| Industrial | (4) | (5) | 21% |
| R&D | (12) | (8) | (33)% |
| Multi-Client (Cash) | (73) | (58) | (20)% |
| Marine MC | (62) | (56) | (9)% |
| Land MC | (11) | (2) | (84)% |
| Proceeds from disposals of assets | 0 | 0 | – |
| Segment Free Cash Flow | (8) | (59) | – |
| Lease repayments | (15) | (15) | 1% |
| Paid Cost of debt | (32) | (7) | 78% |
| Plan 2021 | (22) | (19) | 15% |
| Free cash flow from discontinued operations | 0 | 7 | – |
| Net Cash flow | (77) | (92) | (20)% |
| Financing cash flow | 0 | (5) | – |
| Forex and other | (1) | 16 | – |
| Net increase/(decrease) in cash | (78) | (81) | (4)% |
| Supplementary information | |||
| Change in working capital and provisions, included in Segment Operating Cash Flow | 15 | (37) | – |
| COVID-19 plan Cash | (3) | (7) | – |
| Segment Free Cash Flow before COVID-19 plan | (5) | (52) | – |
Total capex was $(71) million, down (20)% quarter-on-quarter:
- Industrial capex was $(5) million,
- Research & Development capex was $(8) million,
- Multi-client cash capex was $(58) million, down (20)% quarter-on-quarter
Segment Free Cash Flow, including $(37) million change in working capital and $(7)m of non-recurring severance cash costs, was $(59) million.
After $(15) million lease repayments, $(7) million paid cost of debt, $(19) million 2021 plan cash costs and $7 million free cash flow from discontinued operations, Net Cash Flow was $(92) million.
First 9 months 2020 Financial Results
| Consolidated Income Statements In million $ |
2019 Sept YTD |
2020 Sept YTD |
Variances % |
| Exchange rate euro/dollar | 1.13 | 1.12 | (0)% |
| Segment revenue | 1,004 | 672 | (33)% |
| GGR | 685 | 492 | (28)% |
| Equipment | 329 | 183 | (44)% |
| Elim & Other | (9) | (2) | 74% |
| Segement Gross Margin | 284 | 124 | (57)% |
| Segment EBITDAs | 515 | 243 | (53)% |
| GGR | 463 | 289 | (37)% |
| Equipment | 74 | 9 | (88)% |
| Corporate | (21) | (17) | 19% |
| Elim & Other | 0 | 0 | – |
| COVID-19 plan | 0 | (38) | – |
| Segment operating income | 175 | (122) | – |
| GGR | 148 | 66 | (55)% |
| Equipment | 51 | (15) | – |
| Corporate | (23) | (19) | 17% |
| Elim & Other | 0 | (0) | – |
| Non-recurring charges | 0 | (154) | – |
| IFRS 15 adjustment | (6) | 7 | – |
| IFRS operating income | 169 | (115) | – |
| Equity from investments | 0 | 0 | – |
| Net cost of financial debt | (98) | (100) | 1% |
| Other financial income (loss) | 4 | 3 | (21)% |
| Income taxes | (11) | (28) | – |
| NRC (Tax & OFI) | – | (53) | – |
| Net income / (loss) from continuing operations | 63 | (293) | – |
| Net income / (loss) from discontinued operations | (151) | (45) | 70% |
| IFRS net income / (loss) | (87) | (338) | – |
| Shareholder’s net income / (loss) | (94) | (340) | – |
| Basic Earnings per share in $ | (0.13) | (0.48) | – |
| Basic Earnings per share in € | (0.12) | (0.43) | – |
Segment revenue was $672 million, down (33)% compared to last year. The respective contributions from the Group’s businesses were 38% from Geoscience, 35% from Multi-Client (73% for the GGR segment) and 27% from Equipment.
GGR segment revenue was $492 million, down (28)% year-on-year
- Geoscience revenue was $253 million, down (9)% year-on-year and more resilient mainly due to backlog.
- Multi-Client sales were $239 million, down (41)% year-on-year.
- Prefunding revenue was $143 million, down (9)% year-on-year. Multi-Client cash capex was $(198) million, up 29% year-on-year and cash prefunding rate was 72%.
- After-sales were $96 million, down (62)% year-on-year, including large one-off transfer fees in Q3 2019.
Equipment revenue was $183 million, down (44)% year-on-year with a drop in equipment market triggered by the Covid-19 crisis.
Segment EBITDAs was $243 million and Adjusted segment EBITDAs was $281 million, before $(38) million of Covid-19 plan costs, down 46% year-on-year, a 42% margin.
GGR adjusted EBITDA margin was at 59% and Equipment adjusted EBITDA margin at 4%.
Segment operating income was $(122) million and Adjusted segment operating income, was $32 million, before $(154) million of non-recurring charges.
IFRS 15 adjustment at operating income level was $7 million and IFRS operating income, after IFRS 15 adjustment, was $(115) million.
Cost of financial debt was $(100) million. The total amount of interest paid during the first 9 months 2020 was $(47) million.
Other Financial Items were $(42) million, including $(45) million of non-recurring charges related to remeasurement of fair value of other financial assets and liabilities.
Taxes were at $(28) million.
Net loss from continuing operations was $(293) million.
| Discontinued operations
Correspond to the former Contractual Data Acquisition and Non-Operated Resources segments. Main aggregates are as follows: -First 9 months 2020 revenue from discontinued operations was $25 million. –Net loss from discontinued operations was $(45) million. –Net Cash flow from discontinued operations was $17 million before Plan 2021. |
Group net loss was $(338) million.
After minority interests, Group loss attributable to CGG shareholders was $(340) million/ €(302) million.
Adjusted Net Loss from continuing operations, excluding $(207) million non-recurring charges, was $(86) million.
Global economic crisis, triggered by Covid-19 pandemic and unprecedented drop in oil price and E&P spending lead CGG to launch cost reduction actions and recognize other non-recurring charges. $(207) million of non-recurring charges were booked during the first 9 months of 2020:
- $(38) million severance cash costs related to Covid-19 plan
- $(69) million non-cash impairment of the multi-client library
- $(23) million non-cash fair value remeasurement of GeoSoftware business available for sale
- $(24) million non-cash goodwill impairment related to GeoConsulting business mainly focused on exploration and appraisal
- $(45) million non-cash remeasurement of other financial assets and liabilities mainly related to Marine Acquisition exit transaction
- $(9) million non-cash impairment of Deferred Tax Assets
| Non-recurring charges (in m$) | 9 months 2020 |
| Operational costs provisions | (38) |
| Multi-client library Impairment | (69) |
| Asset impairment | (23) |
| Goodwill impairment | (24) |
| Other Financial Items (OFI) adjustment | (45) |
| Deferred Tax Assets impairment | (9) |
| Total | (207) |
First 9 months 2020 Cash Flow
| Cash Flow items (in m$) |
2019 Sept YTD |
2020 Sept YTD |
Variances % |
| Segment Operating Cash Flow | 572 | 238 | (58)% |
| CAPEX | (205) | (248) | 21% |
| Industrial | (28) | (18) | (36)% |
| R&D | (24) | (32) | 31% |
| Multi-Client (Cash) | (153) | (198) | 29% |
| Marine MC | (131) | (169) | 29% |
| Land MC | (22) | (29) | 30% |
| Proceeds from disposals of assets | 0 | 0 | – |
| Segment Free Cash Flow | 367 | (9) | – |
| Lease repayments | (41) | (44) | (6)% |
| Paid Cost of debt | (47) | (47) | 2% |
| Plan 2021 | (65) | (69) | (7)% |
| Free cash flow from discontinued operations | (35) | 17 | – |
| Net Cash flow | 179 | (152) | – |
| Financing cash flow | 0 | (5) | – |
| Forex and other | (18) | 11 | – |
| Net increase/(decrease) in cash | 161 | (146) | – |
| Supplementary information | |||
| Change in working capital and provisions, included in Segment Operating Cash Flow | 77 | (1) | – |
| COVID-19 plan Cash | – | (11) | – |
| Segment Free Cash Flow before COVID-19 plan | 367 | 1 | – |
Segment Operating Cash Flow was $238 million compared to $572 million for the first nine months of 2019, a (58)% decrease year-on-year.
Capex was $(248) million, up 21% year-on-year:
- Industrial capex was $(18) million, down (36)% year-on-year,
- Research & Development capex was $(32) million, up 31% year-on-year,
- Multi-client cash capex was $(198) million, up 29% year-on-year.
Including negative change in working capital of $(1) million and $(11) million of COVID-19 plan severance cash costs, Segment Free Cash Flow before lease repayments was at $(9) million.
After lease repayments of $(44) million, payment of interest expenses of $(47) million, CGG 2021 Plan cash costs of $(69) million and positive free cash flow from discontinued operations of $17 million, Group Net Cash Flow was $(152) million.
Balance Sheet
Group gross debt before IFRS 16 was $1,213 million at the end of September 2020 and net debt was $749 million.
Group gross debt after IFRS 16 was $1,375 million at the end of September 2020 and net debt was $910 million.
Group’s liquidity amounted to $465 million at the end of September 2020.