CGG: Announces its Q3 2021 Results
CGG, a world leader in Geoscience, announced today its third quarter 2021 non-audited results.
Commenting on these results, Sophie Zurquiyah, CGG CEO, said:
“I am encouraged by our Q3 results and more importantly by the signs of the gradually increasing demand for our core businesses, supported by the strengthening macro-environment. Our differentiated products and services remain fundamental to solving our client’s challenges in complex sub-surface environments, addressing their digitalization needs and reducing their environmental footprint.
Beyond the core, we are developing and commercially progressing a growing portfolio of business opportunities targeting digital geoscience, energy transition, environmental geoscience, and infrastructure monitoring. These opportunities leverage our leadership technology positions in sophisticated algorithms, high performance computing, earth subsurface data base and sensors, all of which provide new growth for the company”.
| Q3 2021: A solid performance
§ IFRS figures: revenue at $210m, EBITDAs at $58m, OPINC at $20m § Segment revenue at $270m, up 35% year-on-year and up 71% sequentially o Geoscience segment revenue at $77m, stable year-on-year and up 5% sequentially. o Multi-Client segment sales at $92m, up 26% year-on-year and up 149% sequentially. o Equipment segment sales at $101m, up 105% year-on-year and up 113% sequentially. § Segment EBITDAs at $118m a 44% margin and Adjusted* Segment EBITDAs at $118m, § Segment Operating Income at $33m and Adjusted* Segment Operating Income at $33m § Group Net Loss at $(17)m § Net Cash Flow at $(34)m.
9 months 2021: A progressive recovery § IFRS figures: revenue at $591m, EBITDAs at $146m, OPINC at $5m § Segment revenue at $640m, down (5)% year-on-year § Segment EBITDAs at $195m a 31% margin due to low H1 activity and Adjusted* Segment EBITDAs at $193m, § Segment Operating Income at $14m and Adjusted* Segment Operating Income at $6m § Group Net loss at $(148)m divided by two year on year § Net Cash Flow at $(61)m before $(40)m of fees related to the refinancing
Balance Sheet at the end of September § The sale of the physical asset storage business and the sale and lease back of the headquarter building are progressing as planned § Liquidity of $340m and cash liquidity of $240m after reducing gross debt by $28m as part of refinancing. Net debt before IFRS 16 at $987m as of September 30, 2021
Post closing event § The sale of the GeoSoftware business was completed on October 1st 2021 for a total cash consideration of $95m *Adjusted indicators represent supplementary information adjusted for non-recurring charges triggered by economic downturn.
|
Key Figures – Third Quarter 2021
| Key Figures – Quarter In million $ |
2020 Q3 |
2021 Q3 |
Variances % |
| Operating revenues | 178 | 210 | 18% |
| Operating Income | (43) | 20 | – |
| Equity from Investment | – | – | – |
| Net cost of financial debt | (34) | (27) | (21)% |
| Other financial income (loss) | (12) | – | – |
| Income taxes | 1 | (7) | – |
| Net Income / Loss from continuing operations | (88) | (14) | (84)% |
| Net Income / Loss from discontinued operations | (5) | (3) | (44)% |
| Group net income / (loss) | (93) | (17) | 82% |
| Operating Cash Flow | 12 | 76 | – |
| Net Cash Flow | (92) | (34) | 63% |
| Net debt | 910 | 1,113 | 22% |
| Net debt before lease | 749 | 987 | 32% |
| Capital employed | 2,172 | 2,140 | (1)% |
Key Figures – 9 months 2021
| Key Figures IFRS – 9 months In million $ |
2020 9 MONTHS |
2021 9 MONTHS |
Variances % |
| Operating revenues | 669 | 591 | (12)% |
| Operating Income | (115) | 5 | – |
| Equity from Investment | – | – | – |
| Net cost of financial debt | (100) | (94) | (5)% |
| Other financial income (loss) | (42) | (42) | (1)% |
| Income taxes | (37) | (19) | (48)% |
| Net Income / Loss from continuing operations | (293) | (150) | (49)% |
| Net Income / Loss from discontinued operations | (45) | 2 | – |
| Group net income / (loss) | (338) | (148) | 56% |
| Operating Cash Flow | 238 | 235 | (1)% |
| Net Cash Flow | (152) | (61) | 60% |
| Net debt | 910 | 1,113 | 22% |
| Net debt before lease liabilities | 749 | 987 | 32% |
| Capital employed | 2,172 | 2,140 | (1)% |
Key Segment Figures – Third Quarter 2021
| Key Segment Figures – Quarter In million $ |
2020 Q3 |
2021 Q3 |
Variances % |
| Segment revenue | 199 | 270 | 35% |
| Segment EBITDAs | 52 | 118 | – |
| Group EBITDAs margin | 26% | 44% | 18 bps |
| Segment operating income | (38) | 33 | – |
| Opinc margin | (19%) | 12% | 31 bps |
| IFRS 15 adjustment | (5) | (13) | – |
| IFRS operating income | (43) | 20 | – |
| Operating Cash Flow | 12 | 76 | – |
| Segment Net Cash Flow | (92) | (34) | 63% |
| Supplementary information | |||
| Adjusted segment EBITDAs before NRC | 80 | 118 | 47% |
| EBITDAs margin | 40% | 44% | 3 bps |
| Adjusted segment operating income before NRC | (4) | 33 | – |
| Opinc margin | (2%) | 12% | 14 bps |
Key Segment Figures – 9 months 2021
| Key Segment Figures – 9 months In million $ |
2020 9 MONTHS |
2021 9 MONTHS |
Variances % |
| Segment revenue | 672 | 640 | (5)% |
| Segment EBITDAs | 243 | 195 | (20)% |
| Group EBITDAs margin | 36% | 31% | (6) bps |
| Segment operating income | (122) | 14 | – |
| Opinc margin | (18%) | 2% | 20 bps |
| IFRS 15 adjustment | 7 | (9) | – |
| IFRS operating income | (115) | 5 | – |
| Operating Cash Flow | 238 | 235 | (1)% |
| Net Segment Cash Flow | (152) | (61) | 60% |
| Supplementary information | |||
| Adjusted segment EBITDAs before NRC | 281 | 193 | (31)% |
| EBITDAs margin | 42% | 30% | (12) bps |
| Adjusted segment operating income before NRC | 32 | 6 | (82)% |
| Opinc margin | 5% | 1% | (4) bps |
Key figures bridge: Segment to IFRS – Third Quarter 2021
| P&L items In million $ |
Segment figures | IFRS 15 adjustment | IFRS figures |
| Total Revenue | 270 | (59) | 210 |
| OPINC | 33 | (13) | 20 |
| Cash Flow Statement items In million $ |
Segment figures | IFRS 15 adjustment | IFRS figures |
| EBITDAs | 118 | (59) | 58 |
| Change in Working Capital & Provisions | (48) | 59 | 11 |
| Cash Provided by Operations | 76 | – | 76 |
| Multi-Client Data Library NBV In million $ |
Segment figures | IFRS 15 adjustment | IFRS figures |
| Opening Balance Sheet , Jun 21 | 313 | 203 | 516 |
| Closing Balance Sheet , Sep 21 | 311 | 245 | 556 |
Key figures bridge: Segment to IFRS – 9 months 2021
| P&L items In million $ |
Segment figures | IFRS 15 adjustment | IFRS figures |
| Total Revenue | 640 | (49) | 591 |
| OPINC | 14 | (9) | 5 |
| Cash Flow Statement items In million $ |
Segment figures | IFRS 15 adjustment | IFRS figures |
| EBITDAs | 195 | (49) | 146 |
| Change in Working Capital & Provisions | 39 | 49 | 88 |
| Cash Provided by Operations | 235 | – | 235 |
| Multi-Client Data Library NBV In million $ |
Segment figures | IFRS 15 adjustment | IFRS figures |
| Opening Balance Sheet , Jan 1st 21 | 285 | 207 | 492 |
| Closing Balance Sheet , Sep 30th 21 | 311 | 245 | 556 |
Third Quarter 2021 Segment Financial Results
Geology, Geophysics & Reservoir (GGR)
| Geology, Geophysics & Reservoir (GGR) In million $ |
2020 Q3 |
2021 Q3 |
Variances % |
| Segment revenue | 150 | 168 | 12% |
| Geoscience (SIR) | 77 | 77 | – |
| Multi-Client | 73 | 92 | 26% |
| Prefunding | 39 | 59 | 51% |
| After-Sales | 34 | 32 | (4)% |
| Segment EBITDAs | 56 | 106 | 88% |
| EBITDAs Margin | 38% | 63% | 25 bps |
| Segment operating income | (25) | 30 | – |
| OPINC Margin | (16%) | 18% | 34 bps |
| Equity from investments | – | – | – |
| Capital employed (in billion $) | 1.7 | 1.6 | (3)% |
| Supplementary information | |||
| Adjusted segment EBITDAs before NRC | 85 | 107 | 26% |
| EBITDAs Margin | 57% | 63% | 6 bps |
| Adjusted segment OPINC before NRC | 10 | 30 | – |
| OPINC Margin | 6% | 18% | 12 bps |
| Other Key Metrics | |||
| Multi-Client cash capex ($m) | (58) | (57) | 1% |
| Multi-Client cash prefunding rate (%) | 68% | 103% | 36 bps |
GGR segment revenue was $168 million, up 12% year-on-year and up 53% sequentially.
- Geoscience revenue was $77 million, stable year-on-year and up 5% sequentially.
Market recovery is accelerating driven by high-end marine & OBN projects for reservoir optimization mainly for IOCs. At the end of September total order intakes were up 10% year-on-year and up more than 50% sequentially. Demand for technology remains strong as projects are mainly dedicated to reservoir optimization and near-field exploration.
Beyond the core new businesses activity is improving with commercial bids related to beyond the core representing more than 10% of total Geoscience bids pending at the end of September.
- Multi-Client revenue was $92 million, up 26% year-on-year and up 149% sequentially.
Multi-client cash capex was $(57) million this quarter, stable year-on-year and dedicated to marine multi-client programs only. In Q3 we had three vessels working on multi-client programs, two on a five-month 3D multi-client program in the Norwegian North Sea and one in Brazil on our on-going Nebula project. We also had 5 reprocessings projects this quarter including a new one in the US Gulf of Mexico.
Prefunding revenue of our multi-client projects was $59 million, up 51% year-on-year and prefunding rate was 103%.
Multi-client after-sales were at $32 million this quarter, down (4)% year-on-year.
The segment library Net Book Value was $311 million ($556 million after IFRS 15 adjustments) at the end of September 2021, split 89% offshore and 11% onshore.
GGR segment EBITDAs was $106 million, a strong 63% margin, and GGR Adjusted* segment EBITDAs was $107 million.
GGR segment operating income was $30 million.
GGR capital employed decreased to $1.6 billion at the end of September 2021.
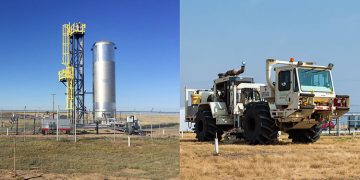
Equipment
| Equipment In million $ |
2020 Q3 |
2021 Q3 |
Variances % |
| Segment revenue | 50 | 101 | 105% |
| Land | 31 | 40 | 28% |
| Marine | 15 | 55 | – |
| Downhole gauges | 2 | 2 | 28% |
| Non Oil & Gas | 3 | 4 | 52% |
| Segment EBITDAs | (1) | 17 | – |
| EBITDAs margin | (1%) | 17% | 18 bps |
| Segment operating income | (9) | 9 | – |
| OPINC Margin | (18%) | 9% | 27 bps |
| Capital employed (in billion $) | 0.6 | 0.6 | – |
| Supplementary information | |||
| Adjusted segment EBITDAs before NRC | (0) | 17 | – |
| EBITDAs margin | (0%) | 17% | 17 bps |
| Adjusted segment OPINC before NRC | (9) | 9 | – |
| OPINC margin | (17)% | 9% | 26 bps |
| EquipEOment In million $ |
2020 Q3 |
2021 Q3 |
Variances % |
Equipment segment revenue was $101 million, up 105% year-on-year and up 113% sequentially.
- Land equipment sales were $40 million, i.e. 40% of total sales, as we delivered in China, Russia, North Africa and India.
- Marine equipment sales were $55 million, representing 54% of total sales, due to scheduled delivery of 18,000 GPR300 nodes.
- Downhole equipment sales were $2 million and sales of non Oil & Gas equipment were $4 million with first commercial project for S-scan railtrack monitoring solution.
Equipment segment EBITDAs was $17 million, a 17% margin.
Equipment segment operating income was $9 million, a 9% margin.
Equipment capital employed stabled at $0.6 billion at the end of September 2021.
Third Quarter 2021 Financial Results
| Consolidated Income Statements In million $ |
2020 Q3 |
2021 Q3 |
Variances % |
| Exchange rate euro/dollar | 1.17 | 1.19 | 2% |
| Segment revenue | 199 | 270 | 35% |
| GGR | 150 | 168 | 12% |
| Equipment | 50 | 101 | 105% |
| Elim & Other | (1) | (0) | – |
| Segment Gross Margin | 27 | 63 | 137% |
| Segment EBITDAs | 52 | 118 | 126% |
| GGR | 85 | 107 | 26% |
| Equipment | (0) | 17 | – |
| Corporate | (5) | (5) | – |
| Elim & Other | 1 | (1) | – |
| COVID-19 plan | (28) | (0) | – |
| Segment operating income | (38) | 33 | 186% |
| GGR | 10 | 30 | – |
| Equipment | (9) | 9 | – |
| Corporate | (6) | (5) | 10% |
| Elim & Other | 1 | (2) | – |
| Non recurring charges | (34) | (1) | 98% |
| IFRS 15 adjustment | (5) | (13) | – |
| IFRS operating income | (43) | 20 | – |
| Equity from investments | – | – | – |
| Net cost of financial debt | (34) | (27) | 21% |
| Other financial income (loss) | (4) | (0) | 99% |
| Income taxes | 1 | (7) | – |
| NRC (Tax & OFI) | (8) | – | – |
| Net income / (loss) from continuing operations | (88) | (14) | 84% |
| Net income / (loss) from discontinued operations | (5) | (3) | 44% |
| IFRS net income / (loss) | (93) | (17) | 82% |
| Shareholder’s net income / (loss) | (93) | (17) | 82% |
| Basic Earnings per share in $ | (0.13) | (0.02) | 82% |
| Basic Earnings per share in € | (0.11) | (0.02) | 82% |
Segment revenue was $270 million, up 35% year-on-year and up 71% sequentially. The respective contributions from the Group’s businesses were 28% from Geoscience, 34% from Multi-Client (62% for the GGR segment) and 38% from Equipment.
Segment EBITDAs was $118 million, up 126% year-on-year, a solid 44% margin and Adjusted* segment EBITDAs was $118 million, up 47% year-on-year.
Segment operating income was $33 million up 186% year-on-year, a 12% margin and Adjusted* segment operating income was $33 million.
IFRS 15 adjustment at operating income level was $(13)million and IFRS operating income, after IFRS 15 adjustment, was $20 million.
Cost of financial debt was $(27) million.
Taxes were at $(7) million.
Net loss from continuing operations was $(14) million.
| Q3 2021 Discontinued operations : Correspond to the former Contractual Data Acquisition and Non-Operated Resources segments. Main aggregates are as follows:
– Revenue from discontinued operations was $0 million. – Net loss from discontinued operations was $(3) million. – Net Cash flow from discontinued operations was $(15) million. |
Group net loss was $(17) million.
After minority interests, Group net loss attributable to CGG shareholders was $(17) million/ €(15) million.
Third Quarter 2021 Cash Flow
| Cash Flow items In million $ |
2020 Q3 |
2021 Q3 |
Variances % |
| Segment Operating Cash Flow | 12 | 76 | – |
| CAPEX | (71) | (73) | 2% |
| Industrial | (5) | (8) | 47% |
| R&D | (8) | (7) | (7)% |
| Multi-Client (Cash) | (58) | (57) | (1)% |
| Marine MC | (56) | (57) | 1% |
| Land MC | (2) | (0) | (74)% |
| Proceeds from disposals of assets | (0) | (1) | – |
| Segment Free Cash Flow | (59) | 2 | – |
| Lease repayments | (15) | (14) | (4)% |
| Paid Cost of debt | (7) | (0) | (96)% |
| Plan 2021 | (19) | (7) | (64)% |
| Free cash flow from discontinued operations | 7 | (15) | – |
| Net Cash flow | (92) | (34) | 63% |
| Financing cash flow | (5) | (2) | (60)% |
| Forex and other | 16 | (9) | – |
| Net increase/(decrease) in cash | (81) | (45) | 44% |
| Supplementary information | |||
| Change in working capital and provisions, included in Segment Operating Cash Flow | (37) | (48) | 30% |
| From severance cash costs | (7) | (5) | 28% |
| Segment Free Cash Flow before severance cash costs | (52) | 7 | 113% |
Segment Operating Cash Flow was $76 million.
Total capex was $(73) million:
- Industrial capex was $(8) million,
- Research & Development capex was $(7) million,
- Multi-client cash capex was $(57) million
Segment Free Cash Flow was $2 million.
Net Cash Flow was $(34) million, after $(14) million lease repayments, $(0) million paid cost of debt, $(7) million 2021 Plan cash costs and $(15) million free cash flow from discontinued operations
9 months 2021 Financial Results
| Consolidated Income Statements In million $ |
YTD September 2020 | YTD September 2021 | Variances % |
| Exchange rate euro/dollar | 1.12 | 1.20 | 7% |
| Segment revenue | 672 | 640 | (5)% |
| GGR | 492 | 379 | (23)% |
| Equipment | 183 | 262 | 43% |
| Elim & Other | (2) | (1) | 66% |
| Segment Gross Margin | 124 | 89 | (28)% |
| Segment EBITDAs | 243 | 195 | (20)% |
| GGR | 289 | 187 | (35)% |
| Equipment | 9 | 25 | – |
| Corporate | (17) | (13) | 23% |
| Elim & Other | (0) | (6) | – |
| COVID-19 plan | (38) | 2 | – |
| Segment operating income | (122) | 14 | – |
| GGR | 66 | 26 | (60)% |
| Equipment | (15) | 1 | – |
| Corporate | (19) | (16) | 18% |
| Elim & Other | (0) | (6) | – |
| Non recurring charges | (154) | 9 | – |
| IFRS 15 adjustment | 7 | (9) | – |
| IFRS operating income | (115) | 5 | – |
| Equity from investments | – | – | – |
| Net cost of financial debt | (100) | (94) | (5)% |
| Other financial income (loss) | 3 | (42) | – |
| Income taxes | (28) | (19) | (32)% |
| NRC (Tax & OFI) | (53) | – | – |
| Net income / (loss) from continuing operations | (293) | (150) | 49% |
| Net income / (loss) from discontinued operations | (45) | 2 | – |
| IFRS net income / (loss) | (338) | (148) | 56% |
| Shareholder’s net income / (loss) | (340) | (150) | 56% |
| Basic Earnings per share in $ | (0.48) | (0.21) | 56% |
| Basic Earnings per share in € | (0.43) | (0.21) | 56% |
Segment revenue for the first 9 months 2021 was $640 million, down (5)% compared to last year. The respective contributions from the Group’s businesses were 34% from Geoscience, 25% from Multi-Client (59% for the GGR segment) and 41% from Equipment.
GGR segment revenue was $379 million, down (23)% year-on-year
- Geoscience revenue was $216 million, down (15)% year-on-year
- Multi-Client sales reached $163 million, down (32)% year-on-year. Prefunding revenue was $92 million, down (36)% year-on-year. Multi-Client cash capex was $(131) million, down (34)% year-on-year. Cash prefunding rate was 70%.
After-sales were $71 million, down (26)%.
Equipment revenue was $262 million, up 43% year-on-year.
Segment EBITDAs was $195 million, down (20)% year-on-year, a 31% margin. GGR EBITDA margin due to low H1 activity. GGR EBITDA margin was 49% and Equipment EBITDA margin was 9%.
Segment operating income was $14 million.
IFRS 15 adjustment at operating income level was $(9) million and IFRS operating income, after IFRS 15 adjustment, was $5 million.
Cost of financial debt was $(94) million. The total amount of interest paid at the end of September was $(37) million.
Other Financial Items were $(42) million, including $(40) million of fees related to the refinancing.
Taxes were at $(19) million.
Net income from continuing operations was $(150) million.
YTD September Discontinued operations :
Correspond to the former Contractual Data Acquisition and Non-Operated Resources segments. Main aggregates are as follows:
-Revenue from discontinued operations was $19 million.
–Net income from discontinued operations was $2 million.
–Net Cash flow from discontinued operations was $(14) million.
Group net loss was $(148) million.
After minority interests, Group loss attributable to CGG’s shareholders at the end of September 2021 was $(150) million / €(125) million.
Cash Flow
| Cash Flow items In million $ |
YTD September 2020 | YTD September 2021 | Variances % |
| Segment Operating Cash Flow | 238 | 235 | (1)% |
| CAPEX | (248) | (172) | (31)% |
| Industrial | (18) | (17) | (3)% |
| R&D | (32) | (24) | (26)% |
| Multi-Client (Cash) | (198) | (131) | (34)% |
| Marine MC | (169) | (130) | (23)% |
| Land MC | (29) | (1) | (95)% |
| Proceeds from disposals of assets | (0) | (4) | – |
| Segment Free Cash Flow | (9) | 59 | – |
| Lease repayments | (44) | (44) | |
| Paid Cost of debt | (47) | (37) | (21)% |
| Plan 2021 | (69) | (26) | (63)% |
| Free cash flow from discontinued operations | 17 | (14) | – |
| Net Cash flow | (152) | (61) | 60% |
| Financing cash flow | (5) | (69) | – |
| Forex and other | 11 | (15) | – |
| Net increase/(decrease) in cash | (146) | (146) | |
| Supplementary information | |||
| Change in working capital and provisions, included in Segment Operating Cash Flow | (1) | 39 | – |
| From severance cash costs | (11) | (17) | (53)% |
| Segment Free Cash Flow before severance cash costs | 1 | 76 | – |
Segment Operating Cash Flow was $235 million compared to $238 million for the 9 months of 2020, stable year-on-year.
Capex was $(172) million, (31)% decrease year-on-year,
- Industrial capex was $(17) million, (3)% decrease year-on-year,
- Research & Development capex was $(24) million, (26)% decrease year-on-year,
- Multi-client cash capex was $(131) million, (34)% decrease year-on-year.
Segment Free Cash Flow was at $59 million compared to $(9) million in 2020.
After the lease repayments of $(44) million, CGG 2021 Plan cash costs of $(26) million, Paid cost of debt of $(37) million and Free cash flow from discontinued operations of $(14) million, Group Net Cash Flow was $(61) million, compared to $(152) million for the 9 months of 2020.
Refinancing impact on cash flow was $(69) million, including $(40) million refinancing fees and call premiums, and $(28) million net reduction in principal.
Balance Sheet
Group’s liquidity amounted to $340 million at the end of September 30, 2021 and cash liquidity of $240m after reducing gross debt by $28m as part of refinancing.
Group gross debt before IFRS 16 was $1,226 million at the end of September 30, 2021 and net debt was $987 million.
Group gross debt after IFRS 16 was $1,353 million at the end of September 30, 2021 and net debt was $1,113 million.
Segment leverage ratio of Net debt to Adjusted segment EBITDAs was 3.5x at the end of September 2021.
Q3 2021 Conference call
- The press release and the slide presentation are available on our website cgg.com
- An English language analysts conference call is scheduled today at 6.30 pm (CET)
To follow the conference call, please access the audio webcast from your computer at www.cgg.com