
Deloitte: Overview of the Russian Oil Services Market
The Russian oilfield services market saw the key trends from previous years holding strong in 2018. Even though the market still faces serious barriers to development and unresolved issues persist, several factors have emerged that could drive the growth of key industry indicators, and consequently, boost its investment attractiveness. As part of this comprehensive analysis, in addition to studying the performance of key market segments, we will pay special attention to assessing some of the factors affecting the market.
Performance of Key segments of the Oilfield Services market
Drilling:
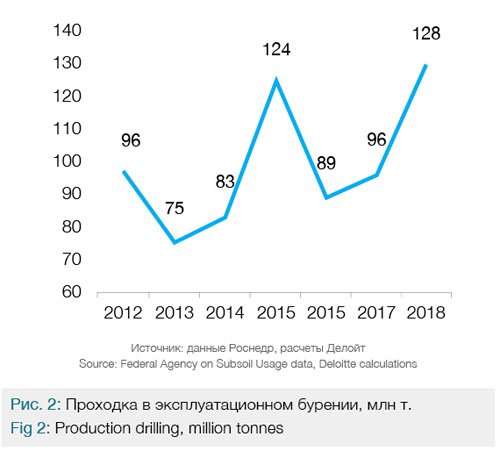
Physical production drilling volumes remained unchanged in 2018 compared to 2017 for variety of reasons: the growth in horizontal drilling, OPEC+ production restrictions, as well as subdued investment in new fields.
Slavneft and Rosneft-controlled Bashneft recorded the most significant growth in drilling volumes (4 percent and 8 percent, respectively). However, these companies also saw production decline, indicating that they are mainly operating mature fields and that the increased drilling is not sufficient to maintain production levels.
The rise in drilling among small oil companies (by 7 percent year-on-year) was another interesting trend in 2018.

According to the license obligations of subsoil users, 2018 saw the number of drilling operations reach its highest level since 2012. These figures likely reflect the significant rise in both production and exploration drilling by small oil companies.
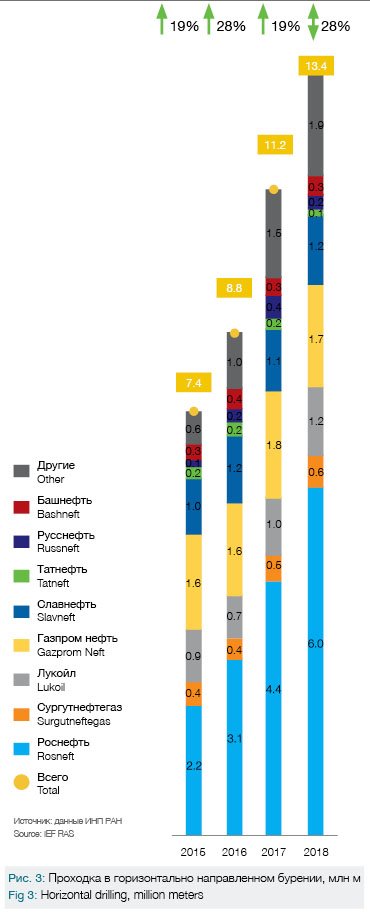
The robust growth in horizontal drilling volumes is a prominent trend on the oilfield services market, increasing three-fold (by 9.1 million meters) since 2013 and rising 19 percent in 2018 alone. Rosneft, which conducts the most drilling (45 percent of the total), is fueling this trend, boosting drilling volumes by 36 percent in 2018.
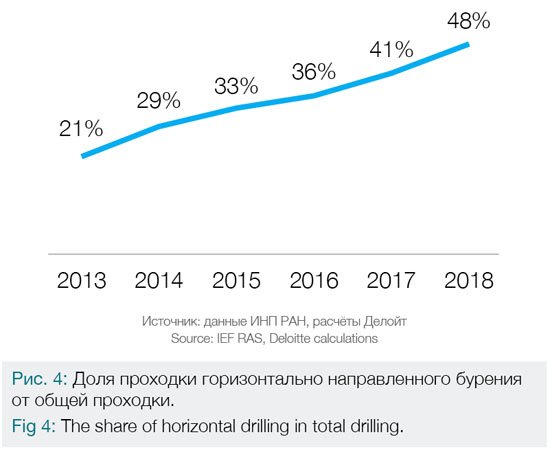
The share of horizontal drilling in total production drilling rose from 21 percent to 48 percent in 2013-2018, this growth reflects global developments in the drilling segment. However, this trend is widely expected to fizzle out in the coming years.
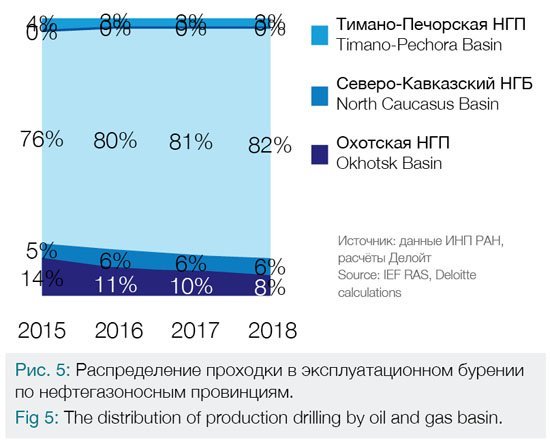
Advances in horizontal drilling are, in many ways, determining the fundamental changes in the industry’s overall structure, and by region in particular. We started to see that West Siberia’s share increased in 2018, while production drilling and oil output started growing again in 2016 and 2017 respectively.
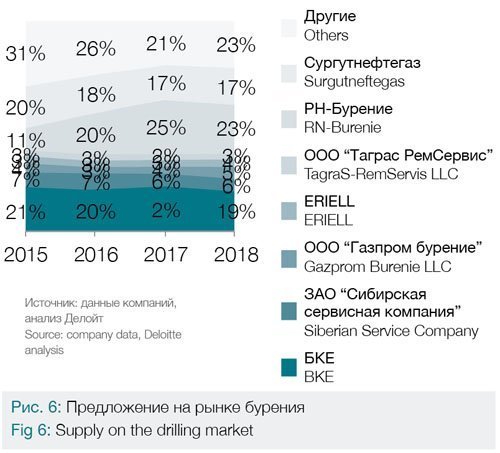
Over the past year, Eurasia Drilling Company (EDC) share of total supply on the drilling market decreased slightly to 19 percent. However, it remains the leading independent oilfield service company. Rosneft Drilling accounts for a large share of the supply from vertically integrated companies (23 percent), and has significantly increased supply since 2015.
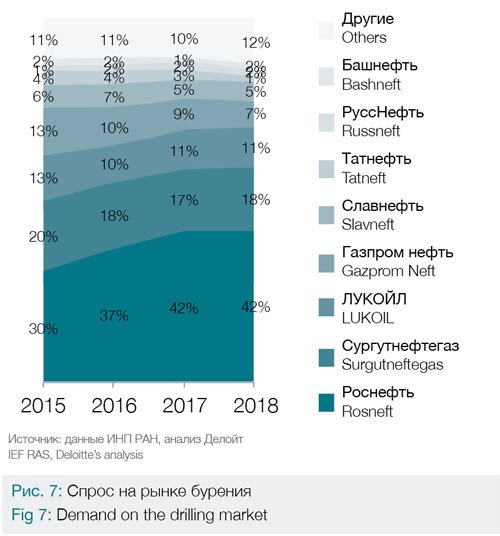
Rosneft accounts for 42 percent of drilling demand while Surgutneftegas and Lukoil jointly account for another 29 percent.
Well Maintenance
Total workover costs increased by 50 percent in 2018. This was due to well aging, which increases the complexity and labor intensity to maintain them.
The companies spent a combined RUB 206.5 billion on workover. Most of the growth was due to rising repair costs at Yamal LNG (accounting for 22 percent of the total).
Workover costs at Rosneft rose 47 percent to nearly RUB 60 billion.
Gazprom Neft and Slavneft recorded a decline in workover costs (by 14 percent and 15 percent, respectively).

Enhanced Oil Recovery (Hydraulic Fracturing)
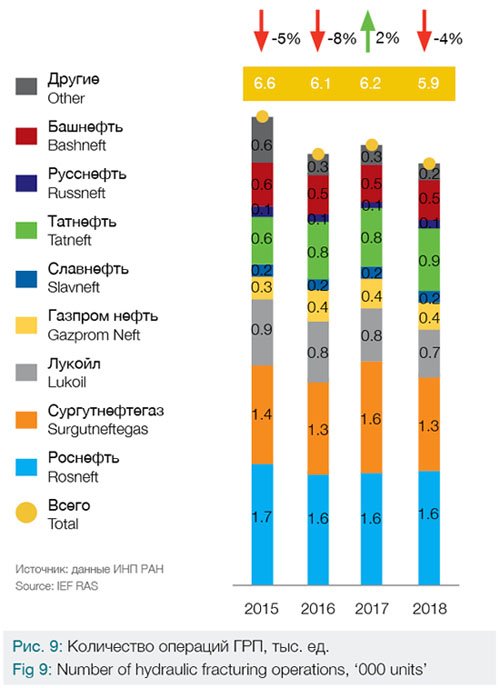
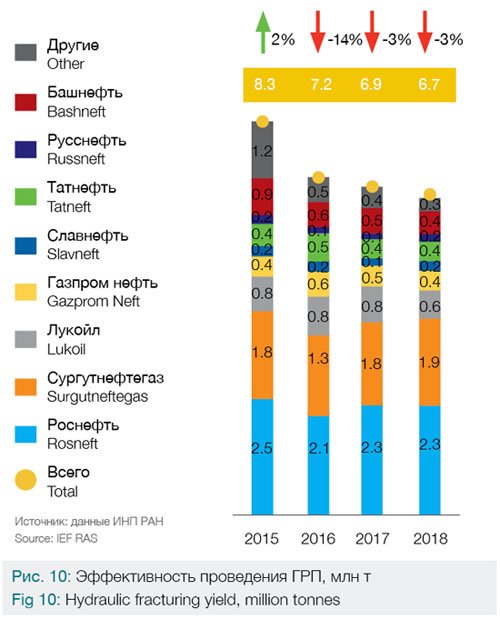
Russian companies performed 5,921 hydraulic fracturing operations in 2018, a 4 percent decline on 2017. Surgutneftegas decreased the number of operations by 17 percent.
Hydraulic fracturing yield totaled 6.7 million tonnes in 2018, down 3 percent compared with 2017. Despite an overall decline in the number of hydraulic fracturing operations, Surgutneftegas managed to achieve a 6 percent increase in its yield (to 1.9 million tonnes). At the same time, Lukoil saw yield fall 20 percent to 0.6 million tonnes.
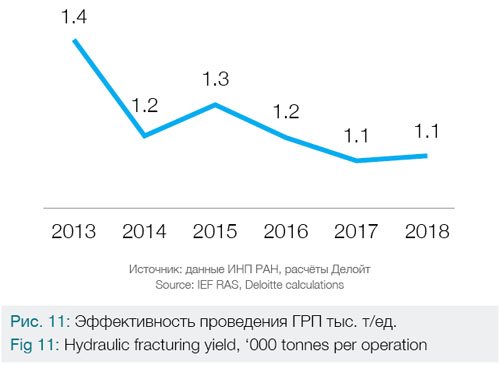
The hydraulic fracturing yield in Russia has been falling over the past few years. In 2013, the average yield was 1,426 tonnes of oil per operation. This figure fell to 1,135 tonnes in 2018. The main reasons for declining yields are insufficient geological knowledge, technological deficiencies and conducting hydraulic fracturing manually.
International oilfield service companies are actively adopting technological solutions such as hydraulic fracturing simulators and software to automate the management of the hydraulic fracturing fleet. Russian companies are only just making their first steps in this direction.
Seismic Exploration
*О- оценочные данные – *E: estimate
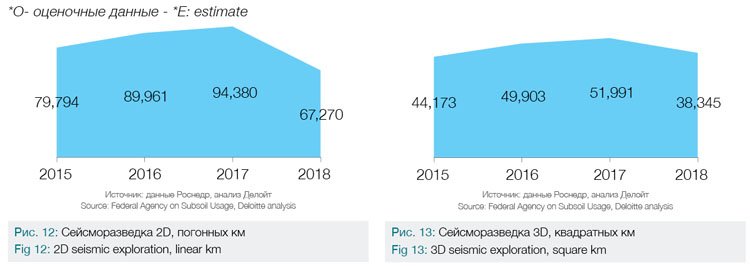
2D seismic explorations were down 40 percent to 67,270 linear km in 2018.
3D seismic explorations also decreased by 36 percent (to 38,345 square km)
in 2018.
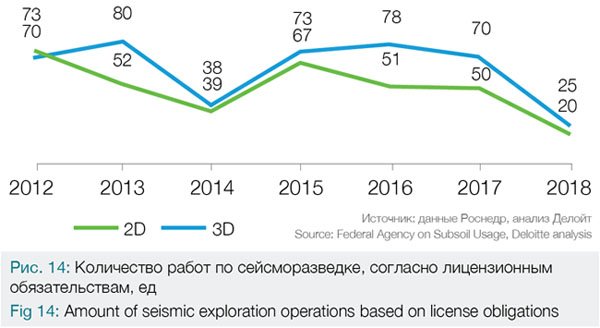
According to license obligations, the amount of 2D and 3D seismic exploration operations fell 60% in 2018 (by 24 and 30 operations respectively).
This decline was mainly driven by a fall in investment activity in under-explored subsoil plots. Small oil companies, who are investing in the exploration of plots that do not contain sufficient hydrocarbon volumes to interest the vertically integrated oil companies, could become a growth driver for the market.
Market Drivers
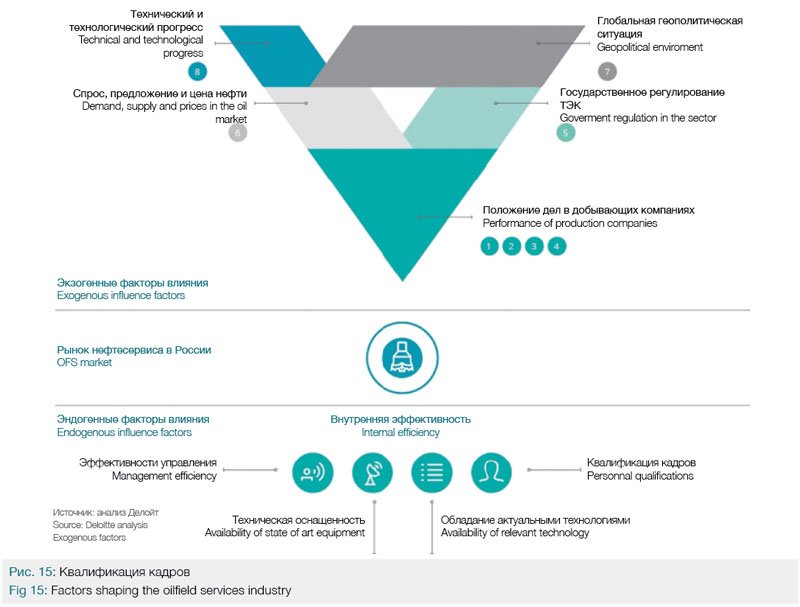
In order to draw conclusions about the current state of the Russian oilfield services market, it is important to analyze the key factors influencing the market, consider the current trends associated with these factors, and assess whether these trends are positive or negative for the market.
There are two groups of factors: exogenous and endogenous. Exogenous or external factors influence each other, and ultimately the Russian oilfield services market (e.g. government regulation of the industry). Endogenous factors, which affect the market from within, are internal factors that affect the in-house efficiency of market players.
Factor 1. Tougher Production Conditions
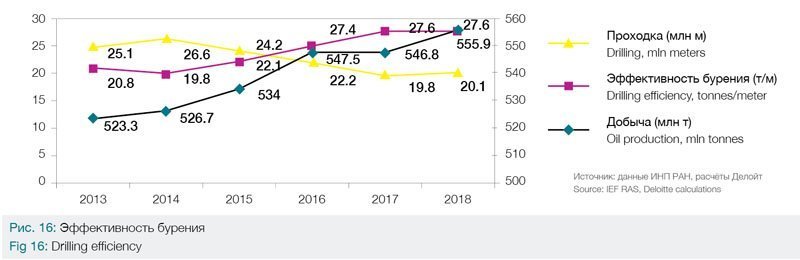
The drilling yield is a key indicator: on the one hand, it demonstrates that production conditions have deteriorated, and on the other, shows that the industry is unprepared to face the current market challenges.
Drilling efficiency rose by 1.7 percent in 2018. However, the cumulative average annual growth rate (CAGR) of tonnes per meter of production drilling in 2013-2018 was -3.6 percent, indicating a gradual decline in drilling efficiency over the past six years. Gazprom Neft had the highest CAGR with 11.9 percent and Bashneft—the lowest with -21.3 percent. Bashneft (65.9 tonnes/meter) and Tatneft (50.1 tonnes/meter) have the highest average drilling efficiency and Slavneft (11.9 tonnes/meter)—the lowest.

Oilfield service market drivers

Higher demand for specific services
Oilfield service market barriers
Growing technical equipment requirements
Factor 2. Market consolidation around vertically integrated companies
A decade ago, the largest companies were spinning off their oilfield service units; however, the opposite has been true since 2013.The oilfield services market is actively consolidating around vertically integrated oil companies, with the market share of oil companies’ service units exceeding 50 percent in some segments. Surgutneftegas (in-house services cover almost all the company’s drilling needs) and Rosneft (currently covers 60% of its needs, with the goal of completely switching to in-house services in the medium term) are both indicative of this trend.
Technological development is concentrated around vertically integrated oil companies
Consolidation of financial resources
Muted demand for services
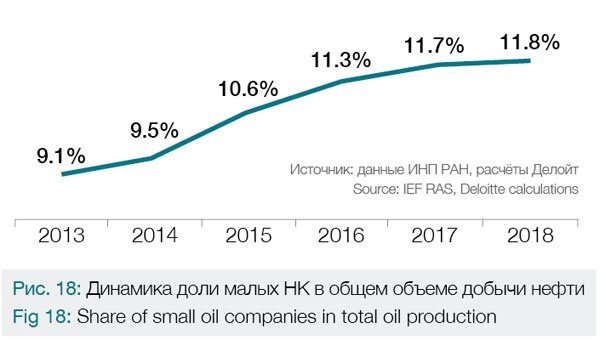
Factor 3. Growing production in small oil companies
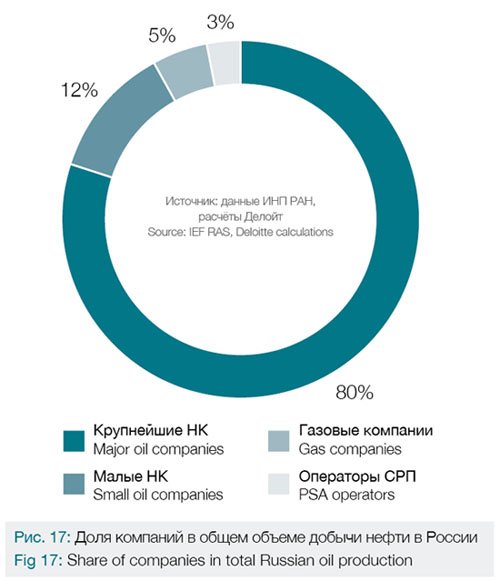
An interesting trend continued within the small oil company market in 2018: despite a relatively insignificant share in total production, their production results and market share have been increasing over the past few years. In 2018, they accounted for nearly 12 percent of the total oil production in Russia. Their total output was 65.5 million tonnes in 2018, a 2.5 percent increase on 2017. The compound annual average growth rate (CAGR) of production was 6.6 percent.
International experience shows that the development of the small oil company market is very important: in developed oil-producing countries, small companies are the engine of the market, employing cutting-edge technologies and leading the way in efficient subsoil use, environmental protection, complex oil refining and the exploration and development of small and medium-sized fields, etc. Unfortunately, there are many factors limiting the development of small companies in Russia, which is why signs of growth in this segment are encouraging.
From the standpoint of the oil services industry, this is a positive development for independent oilfield services companies: small oil companies could fill the gap left by vertically integrated oil companies as they move to a self-service model. Of course, the oilfield service market will have to adapt to new conditions and risks when working with small oil companies.
Higher demand for the services of independent oilfield services companies
No guarantee of competitive proposals
Factor 4. Peculiarities of the Russian market
This category includes the typical peculiarities of working in oilfield services in Russia.
The competitive price of Russian oil
Expansion into new markets
Underdeveloped infrastructure
Factor 5. Government regulation of the fuel and energy market
The regulation of the oil and gas industry in Russia can generally be described as a complex and constantly changing system of incentives and restrictions. However, several initiatives (for example, the excess profits tax pilot) represent positive signs for oilfield services companies. The regulation of the oilfield services industry lacks maturity and has numerous gaps (for example, the regulation of relations between the customer and the contractor).
The positive effect of the excess profits tax for the oilfield services industry
Inadequate regulation of the oilfield services market
Factor 6. OPEC+ agreement
The OPEC+ agreement to cut oil output was signed in late 2016 between OPEC and some non-OPEC countries, including Russia. The deal aimed to ensure higher oil prices by reducing oil supply by a combined 1.7-1.8 million bpd.
The price of oil had was below USD 50 per barrel when the agreement was brokered. Following the signing of the OPEC+ deal, oil prices rose above USD 50 per barrel in December 2016 and reached USD 55 by the end of the year.
The production cuts came into effect on 1 January 2017. In the first year, an average of 1.7 million bpd of output was withdrawn from the market and oil prices climbed to around USD 65 per barrel by the end of 2017.
In the first five months of 2018, output cuts exceeded the agreed levels, averaging 2.3 million bpd. However, the OPEC+ signatories returned to average daily cuts of 1.7 million bpd in June-December 2018. Oil prices continued to rise gradually, reaching a peak of over USD 80 per barrel in October 2018.
This fueled a robust increase in US oil production, mainly through shale development. Shale projects have a short investment cycle lasting only a few months and higher oil prices have given this segment an extra boost. By June 2018 since the adoption of the deal, US shale production had increased by more than the OPEC+ oil production cut target.
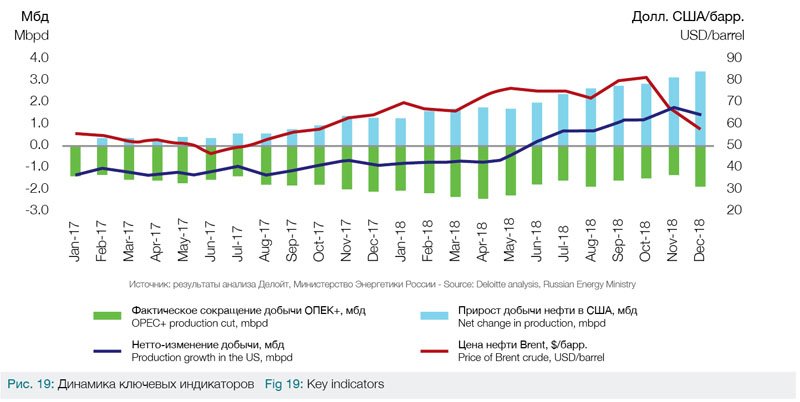
In December 2018, the OPEC+ signatories agreed to revise the original level of cuts down to 1.2 million bpd. This target will cover 1H 2019.
Given the pace of oil production growth in the US, experts do not anticipate a significant rise in oil prices following the cartel’s recent decisions. Current indicators will likely remain unchanged. Forecasts for the average price of oil in 2019 range from USD 55 to USD 70 per barrel, with a majority between USD 60-65 per barrel.
Since a large portion of oilfield service companies’ contracts is tied to the price of oil, we will take a look at the trajectory of oil prices in 2013-2018.
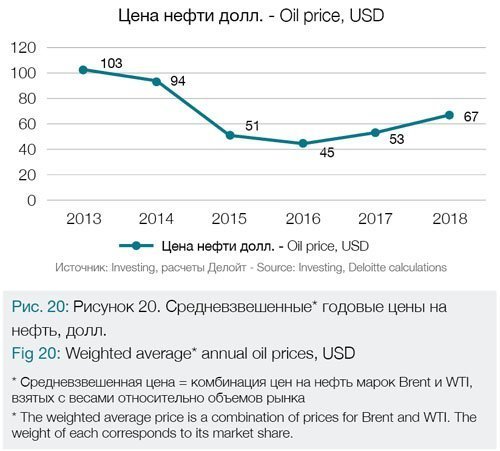
The average annual oil price was 25 percent higher than the average price for the previous three years. Oilfield service companies were unlikely to have felt any immediate benefit from these improved conditions, but if this price environment persists in 2019, as expected (the consensus forecast of the majority of experts is a USD 60-65 per barrel), market players should have reason for optimism.
Favorable price environment
Muted demand for services
Factor 7. US Sanctions
Russian companies are only now beginning to adapt to the realities of import substitution after five years of sanctions: a lot of in-demand technologies are still in their early stages (engineering, piloting) or are not on the market, but active work is underway to complete them, opening up opportunities for oilfield service companies to become pioneers in certain products/services.
Production using hydraulic fracturing technology
Launching new products/services
Offshore engineering
Limited access to foreign capital
Factor 8. Development of technology for hard-to-recover reserves (shale oil)
Progress is not at a standstill, and the oil and gas sector is one of the most prolific investors in R&D, if not the biggest.
Increasing efficiency in hard-to-recover oil production
Lack of access to western technology
Decreasing cost of shale oil production in the US
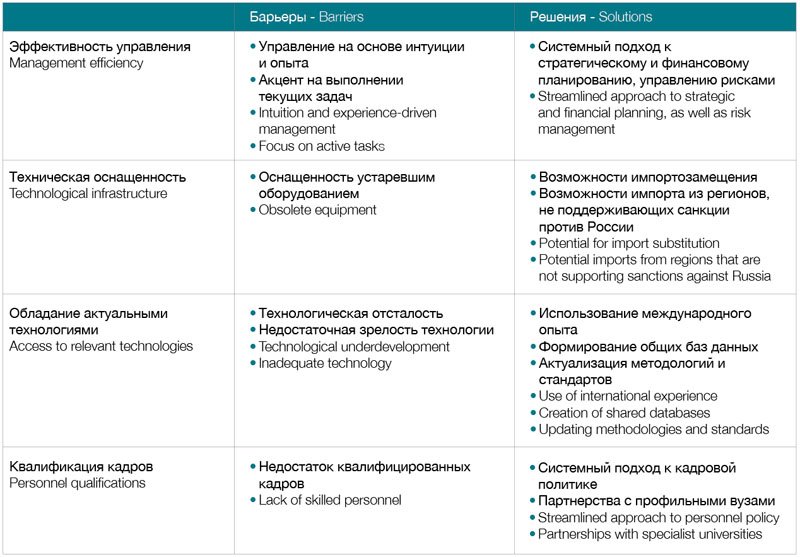
Endogenous Influence Factors
Oilfield services companies in Russia must work on improving internal efficiency to meet the challenges posed by external factors. The table below shows several factors and typical barriers, as well as the tried and tested solutions of Russian and international best practice, which have helped lift companies’ internal efficiency.
Conclusion
In general, key segments of the oilfield services market remained stable in 2018: the market retained its structure. Only certain segments underwent transformations, and these were largely the continuation of pre-existing trends.
This relatively favorable situation will continue into 2019: if companies are able to take advantage of the opportunities and unlock the potential of increased efficiency, the market should expect to see rising volumes and profitability.
Deloitte CIS Research Center