Gazprom Neft: A Case Study of the Zapadno-Tarkosalinskoye Field’s J1 Reservoir – Development Concept Uncertainties and Solutions

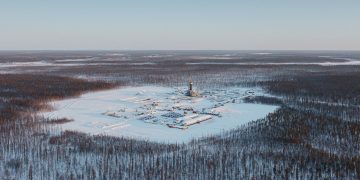
The Zapadno-Tarkosalinskoye oil and gas condensate field is located in the Purovsky region of the Yamalo-Nenets Autonomous Okrug. The field has multilayers and complex geology. The target interval is the terrigenous deposits of the J1 formation. The key uncertainties of the project include the oil-water contact (OWC) level and the phase of the fluids. In addition to these factors the Zapadno-Tarkosalinskoye oil-gas condensate field is characterized with an abnormally high reservoir pressure production interval, and it has a complex structural and tectonic framework with a large number of faults.
The development of the oil deposits, including the J1 formation, began in 2018. As part of the pilot development program in 2018-2020:
• exploratory well 2R was re-tested with a downhole logging;
• five dual-lateral wells (three with a pilot wellbore), two tri-lateral wells (one with a pilot wellbore) and three horizontal monobore wells were drilled;
• well tests were carried out in four production wells;
• production logging was performed in two pilot wells 9PL and 7PL;
• reservoir testing was carried out on logging cable in the pilot borehole of well 7PL;
• fluid samples were taken. Based on new geological and geophysical information the conceptual reservoir and hydrodynamic models were updated and matched to the results of the production wells development.
Geology
The geologic structure features include the trouble zones with fault tectonics. The entire West Siberian Plate, territory of the Nadym-Pur and Pur-Taz syneclises, is subjected to intensive tectonic shearing deformations. Horizontal basement shears are observed in the sedimentary mantle with an echelon system of faults and uplifts that fix the suture zones of the horizontal basement shears. The faults reach different stratigraphic levels and the penetration height characterizes the intensity of the basement tectonic deformations. The amplitude and polarity of the faults vary in depth. Currently, after the release of the horizontal stresses the echelon faults probably form permeability barriers [1].
Within the Zapadno-Tarkosalinskiy license area, numerous amplitude faults (faulting system) are mapped limiting the echelon folds. Based on a comprehensive survey of position of the faults and reflectors in the cross-section, a left-lateral shearing direction is defined. Interpretation of the shear deformation trajectories is shown in Fig. 1.

The seismic data in the J1 reflection layer does not show the expected disjunctive fault lines that separate the hydrodynamically isolated block in the north of the deposit the which was confirmed by the drilling logs.
Before drilling the operating wells, identifying the disjunctive dislocations that separate the deposit into blocks was based on the geometry of the Riedel faults. Block 4R was separated by a presumed impermeable shear line (dashed red line, Fig. 1a) which crosses the Riedel echelon fractures whose configuration is traced from the seismic data. Several analogs such as the Ety-Purovskoe and Yarainerskoe fields show the sealing properties of such shears in the sedimentary cover.
While drilling new production wells, the presumed impermeable barrier near well 9 was not confirmed. There are no anomalies in the logging curves and no mud losses in the horizontal wells. At the same time, the pilot borehole of well 12 drilled in the north of the deposit between wells 4R and 9 confirmed the absence of a hydrodynamic connection between the blocks (Fig. 1b).
Key uncertainties of the reservoir J1 (oil water contact OWC, phase of fluid) in the conditions of abnormally high reservoir pressure and complex geology were clarified by the results of drilling, well operation and laboratory tests.
There are two equally plausible theories have been considered to justify the different oil-water levels. According to the first assumption, the different levels of the fluid contacts can be explained by the presence of several nonconnected sand bodies. The deposits of the J1 reservoir (Vasyugan Formation) were formed under gradual, irregular sea advancements. According to the results of core tests and well logs, the sediments of the J1 layer should be offshore bar facies formed within a shallow shelf. These sediments mostly have homogeneous sandy compositions, and their granularity increases along the cross-section.
The analysis of the logs and lithologies shows lithologic boundaries which may indicate the superposition of several sand bodies/bars which are observed in the core sample with an abrupt change in the grain distribution. That may also indicate that more than one sand body could have been formed in the area.
The position of lateral boundaries with a sparse well spacing, can only be determined using 3D seismic. On the seismic attributes map it is difficult to unambiguously identify the bodies due to the influence of the Bazhenov Formation deposits on the J1 reflector. Since the drilled wells in the cross-section do not indicate a thick persistent shale streak, that would be capable of isolating the overlying bar bodies and excluding hydrodynamic connection, this theory was dismissed for further substantiation of the fluid contacts.
The investigation of the seismic attribute maps for the underlying horizons revealed signs of fault duplex structures which represent a continuation of the discovered faulting system. According to the second theory, the amplitude of these faults reduces in the J1 formation interval. There are no signs of faulting on the attribute maps and in the cross-sections.
Figure 2a shows a Variance attribute map of the underlying bed with highlighted ruptures in the northern part of the deposit, and Figure 2b shows a SW-NE cross-section.

If the fault system continues into the J1 interval, a system of small-amplitude ruptures, coaxial to the mapped faults, in the underlying horizons, may be identified in the northern part of the deposit.
Drilling in the abnormally high reservoir pressure conditions
At the Zapadno-Tarkosalinskoye field the reservoir pressure value in the cross-section gradually increases with depth, except for the Achimov and Jurassic deposits which are characterized by abnormally high reservoir pressures which may be associated with a major tectonic deformation – the Urengoy-Koltogorsk graben-rift. The anomaly ratio is 1.50 which is a complicating factor to the development of the J1 reservoir. In such conditions, the complications of gas, oil, and water breakthrough may arise during completions in abnormally high reservoir pressure conditions without sufficient mud weight. There may be an inability to run casing to target depth, as well as inducing possible wellbore collapse [2].
A linear geomechanical model was created to solve the complications while drilling layers with abnormally high pressures and to identify the optimal drilling parameters, such as mud density, casing running depth and lost circulation zones. Based on the calculations, to ensure accident-free drilling in high-pressure conditions, the production casing shoe was installed above the top of the Achimov deposits, the angle of entry into the target formation was about 70 degrees.
With such a high inclination angle there is an obvious risk of mechanical sticking during production logging and formation testing. That is why the planned formation test could not be performed in well 9’s pilot wellbore. In the second pilot borehole which had a lower inclination, sampling was carried out and oil flow was achieved. Two samples were taken but during the sampling the assembly became stuck (presumably differential). Therefore, it was decided to complete the survey after the well was cleared.
The FT studies to remove any OWC level uncertainties in the complicated geological conditions proved ineffective, and it was not possible to unambiguously determine the OWC from all the surveys in the new wells.
Uncertainty of the oil-water boundary
The key geological uncertainty of the formation is the level of the oil-water contact.
Five exploratory wells were drilled at the start of the development in 2015. Based on the results of logs interpretation the accepted OWC true vertical depth (TVD) is -3105 m in the main block and -3116 m in the northern block. Resistivity boundary values were obtained from the results of relative phase permeability studies to determine the type of fluids. Then, according to Archi-Dakhnov equation, the critical values like Ws* – water saturation at which gravitational water emerges in the flow and Ws** – water saturation at which the flow consists only of gravitational water were expressed. For the reservoir J1 critical resistivity value is 8.2 Ohm-m and the ambiguous saturation zone in the interval ranges from 7.7 to 8.2 Ohm-m. The resistivity values are close to the point that may lead to an error in determining the fluid content. It is notable that water was produced during the test in only one well, while the inflow also produced dissolved gas and a film of oil. Due to the small amount of samples, further study of the water saturation boundary values and resistivity is necessary to determine the saturation behavior. Without new core samples the question of determining the «true» rock resistivity and the corresponding reservoir saturation behavior may be further studied by well logs and geochemical reservoir models. A similar method is described in the work by A.I Melnik. [3].

To date the main uncertainty is the OWC level around the main deposit, as the fluid contact boundary of the northern block near the exploratory well 4R was confirmed by the pilot well logs 12PL, where the OWC TVD is -3115m according to the log results. Fig. 3 shows the scheme of the substantiated fluid contacts. The results determining the OWC level in the drilled wells in the main deposit:
1) Well 2R. According to the well logging results, the J1 formation fluid is in perforated and non-perforated sections in the TVD -3094 ÷ -3109m interval and possibly with less volume in the TVD -3109 ÷ -3115.4m interval. There is gas-cut oil with a small amount of water in the inflow. According to the log data interpretation, the OWC in well 2R is penetrated in the reservoir at TVD -3105.8m.
2) Pilot wellbore of well 9. According to the results of hydrodynamic logging, the OWC level is assumed at the depth of -3101m. At the same time, it is noted that below the depth of -3100.7m there is an increased pressure differential, and below TVD -3102.8m the values become non-physical. These results may be substantiated by a decrease of permeability and porosity in the lower part of the formation and supercharging (the effect of overpressure in the bottomhole due to the slow pressure equalization after mud penetrates the formation). According to the results of logging interpretation, the oil-water contact is at TVD -3105.1m.
3) According to the results of well logging in the TVD interval -3100.4 ÷ -3107.7m a fluid gradient density of 0.729cm3 was obtained. The pressures below TVD -3108m noticeably differ from the measurements in the overlying intervals. Unrealistic values are obtained (2.27g/cm3) when trying to plot the gradient which can also be explained by the difference in the interlayers formation pressures or by the supercharge effect on the measured pressures. After log interpretation the oil-water contact is at TVD -3109m.
4) Pilot borehole of well 14. According to the logging data interpretation, the OWC was penetrated in the reservoir at TVD -3102m.
The surveys did not enable an unambiguously determination of the OWC level but there were preconditions for its reduction to the TVD level of 3108m (based on the results of drilling 7PL well). The well log interpretation data does not precisely define the OWC level.
Features of the reservoir fluid
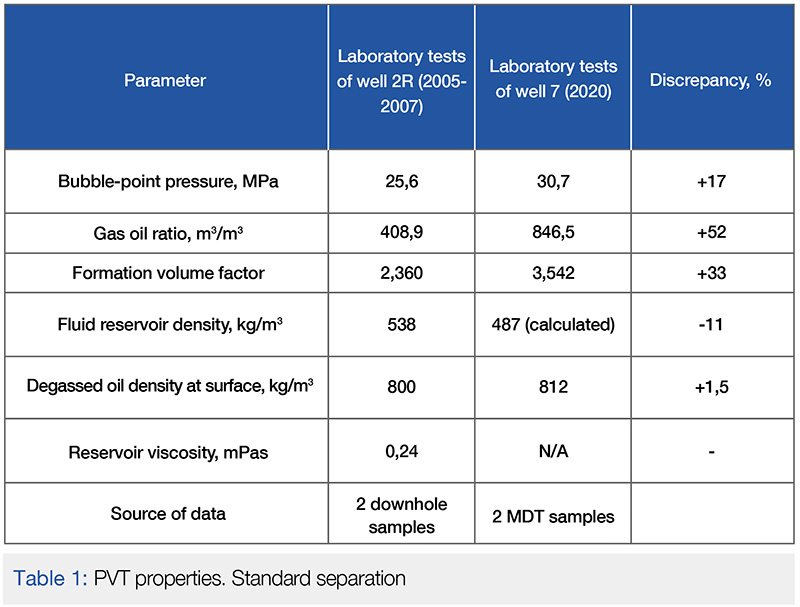
The J1 formation oil is classified as extra light (0.806g/cm3), low-sulfur (0.17 %), and low-resin (2.27 %). As of early 2019, downhole oil samples were taken from wells 2R and 4R. The results showed a wide scatter of initial gas-oil ratio: from 409.9 to 940.8 m3/t (stage separation). That is why in order to clarify the PVT fluid parameters, an investigation program was developed to further study the PVT state of the reservoir system. For the period of 2019-2020 samples were selected:
• by wireline formation tester – 2 samples;
• by downhole sampler – 11 samples;
• in separator – 3 sets of recombination samples.
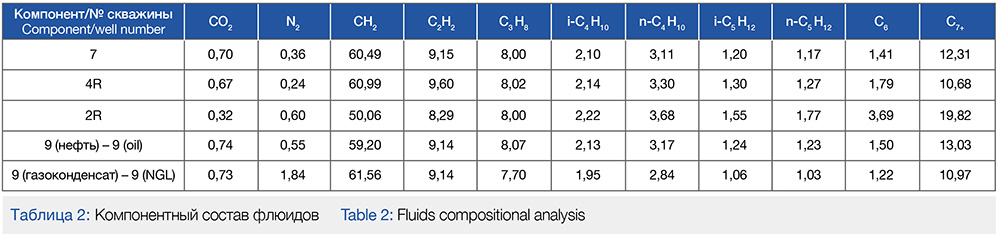
The results of laboratory sample tests from wells 7 (depth sample) and 9 (wellhead sample) confirmed that, most likely, samples from well 2R were partially degassed (gas-oil ratio 408.9-445 m3/m3). Tables 1 and 2 present the results of fluid studies under standard separation.
The completed research program concluded that the reservoir fluid is in near-critical condition and can be interpreted as near-critical oil and gas. A near-critical fluid has formation properties similar to those of both oil and gas. As reservoir pressure decreases, the fluid separates intensely into liquid and gas phases in a near 50/50 ratio. There will be rich gas several tens of meters higher and low-density oil a few meters lower in the reservoir.
The following facts confirm the oil system:
• when the composition is loaded into the PVT simulator, the fluid is defined as black oil. Conversion to a gas state is difficult and is done only by significant adjustments to the C+ fraction;
• with the first recombination of surface formation fluid samples for measured gas-oil ratio an oil system was obtained (at well 9);
• according to the criteria for identifying the type of reservoir fluid (Table 3), the samples under study are mostly defined as oil (57% of the criteria).

The following facts confirm the gas-condensate system:
• according to the results of well production, gas-oil ratio is logged at 700-800m3/m3 under bottomhole pressure, significantly higher than the accepted saturation pressure;
• laboratory experiments performed in 2020 by contact condensation (with visual observation of the fluid phase), one-time degassing and contact-differential condensation confirmed the presence of a gas condensate system with gas-condensate ratio (GCR) 960g/m3 (well 7);
• currently the following conclusions can be drawn based on the laboratory results obtained in 2019-2020:
• reservoir fluid can be identified as near-critical oil and gas;
• it is necessary to update the PVT-model of fluids in the porous-flow model after the results of laboratory sample tests taken from well 12 with different operation conditions (using 4, 7, 8, 9.5 mm chokes) which can give a more accurate understanding of the fluid phase. When updating the model results of samples from wells 7 and 9 were taken into account.
Well tests results
Currently 8 wells are in operation at the field. During the operation the watercut remained at an average level of 0-2% over the year. At the same time, when adjusting to historical data in the hydrodynamic model, the calculated indicators deviate from the actual ones.
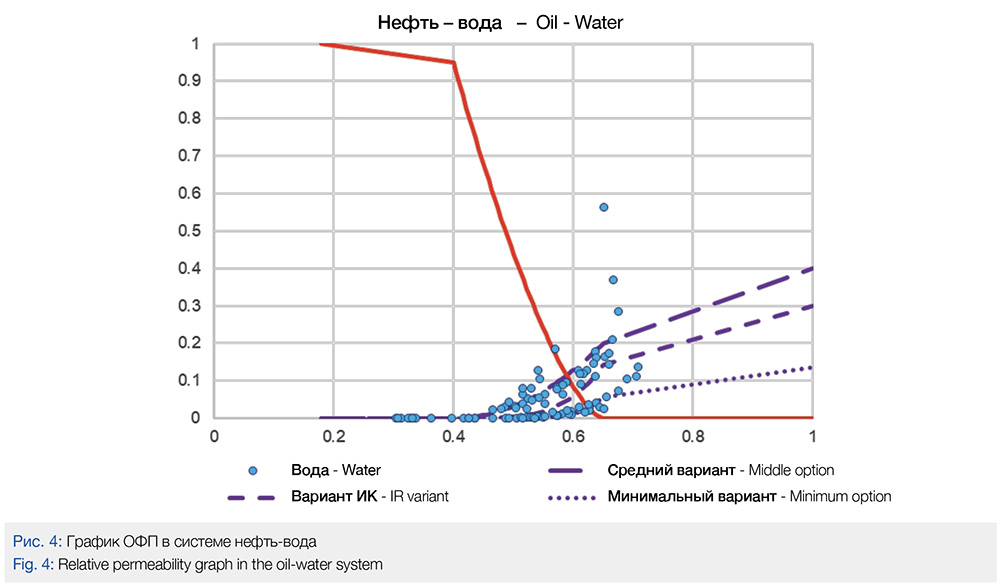
In order to adjust the porous-flow model, a series of multivariate calculations were performed to determine the fluid contact level based on the actual performance of the operating well stock. Parameters for variation:
• OWC -3105m/-3106m/-3107m/-3108m;
• relative permeability (RP) of the middle and minimum options (Fig. 4);
• permeability anisotropy 0.01, 0.03, 0.05, 0.08, 0.1.
Currently the most uncertainty in adjusting the hydrodynamic model (HDM) to historical data is the watercut dynamics in the following wells:
• wells 8 and 9. In these wells watercut in the hydrodynamic model with OWC -3105m is significantly higher than the actual;
• well 11. This well was drilled so that the mark «bottom of the well» is at the TVD of -3105m, corresponding to the depth of the originally assumed OWC.
The graph below (Fig. 5) shows the actual dynamics of watercut at the previously listed wells since well startup.
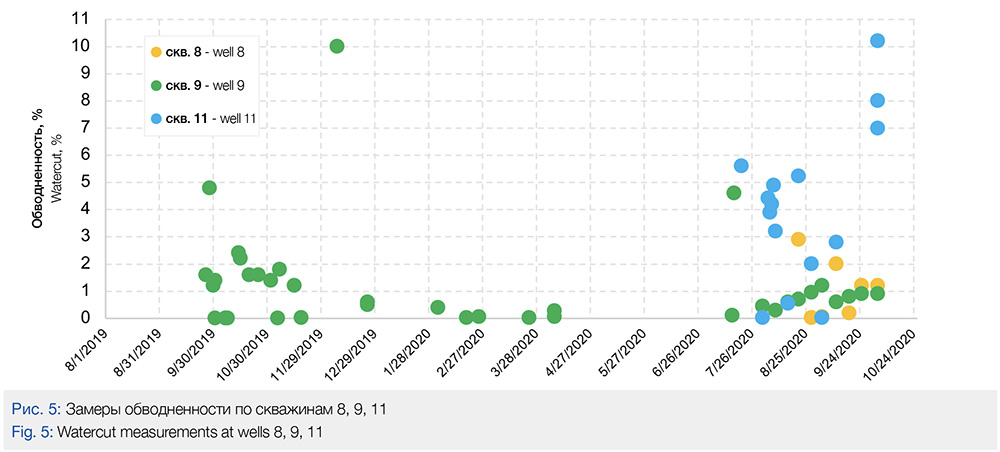
For wells 8 and 9 the watercut at the end of October 2020 was about 1%, for well 11 – 10% (on average for the period of operation ~ 5%). The results of multivariate calculations are presented in Table 4.

• at OWC -3105m well 9 did not adjust for the actual water cut which is 1%;
• at OWC -3106m well 9 adjusts to the actual measurements only at a minimum relative permeability and at minimum values of anisotropy;
• at OWC -3107m, well 9 adapts at the minimum relative permeability, as well as at the average relative permeability and the minimum value of the anisotropy coefficient;
• at OWC -3108m watercut in wells 8, 9 corresponds to the actual watercut.
Due to the fact that well 9 has been in operation for the longest time in the field (more than 1 year), when choosing the base level of OWC, its watercut dynamics were taken into account. For well 11, there is a high scatter of the measured watercut values. In addition, there are currently technical problems with measuring the bottomhole pressure (tool sticking), only one measurement has been made since start-up.
Summarizing the geological and geophysical drilling information, it can be concluded that there are the following preconditions for the reduction of OWC level in the deposit:
• Well 2R. Total oil production from this well during the trial period from 2004 to 2008 were 113,000 tons with a total water production of 4,000 tons. Watercut at the end of trial period was 5%. The hydrodynamic model watercut adaptation in well 2R was also performed with some complications: at OWC -3105m (average RP, anisotropy factor 0,08) the well produced more water more intensively than it did. However, the actual dynamics of the watercut is simulated more precisely at OWC -3108m. It was also previously stated that in 2019, the well logs were conducted, according to the results the J1 formation at TVD -3109m operates with live crude oil with a small amount of water (according to the wellhead data, watercut is 5%).
• Pilot borehole 7PL. In the well 7PL, according to production logging, a formation pressure gradient corresponding to fluid density 0.729 g/cm3 was plotted at the interval depth of TVD -3100.4 ÷ -3107.7m, reservoir testing was also performed and an oil inflow was obtained at TVD -3105.7m.
Taking into account the results of actual watercut measurements conducted by well logging, production and reservoir testing, OWC -3108m was selected as the basis for calculation of forecast production profiles.
Conclusions
• Drilling results confirmed the presence of a hydrodynamically isolated block in the north of the deposit. Low-amplitude disjunctive dislocations coaxial to the mapped faults in the underlying horizons were identified to justify the difference in fluid contact levels in the blocks.
• Multilateral wells were tested and successfully applied in the Jurassic deposits of the Zapadno-Tarkosalinskoye field.
• Under abnormally high reservoir pressure conditions formation testing to remove uncertainties of the OWC level of the J1 reservoir proved ineffective.
• Well log interpretation data does not provide explicit results to determine the fluid contact level.
• Preliminary conclusions about the level of the fluid contact at the developed reservoir at TVD -3108m were made based on the hydrodynamic model. Also, results of the studies and actual operation of the exploration and production well stock were used in the analysis.
• Fluid at the developed formation in reservoir conditions can be identified as near-critical oil and gas (laboratory studies 2019-2020). However, it is more defined as oil. To better understand the fluid phase, it is necessary to update the PVT model and to obtain the results of the laboratory samples taken at different operation conditions in well 12.
• The results obtained during the study of the field, as well as the implementation of the main engineering solutions program and production drilling plan can be taken into account for the development of similar fields.
References
1. Gogonenkov G.N., Kashik A.S., Timurziev A.I. Strike-slip fault of Western Siberia basement. Geologiya nefti I gasa [Oil and gas geology]. 2007, no. 3, pp. 3–11. 2. Rakhmangulov R.R., Yusupov R.R., Rasskazov A.A. Searching for the jurassic period: drilling deep horizontal wells under HPHT conditions. Burenie I neft [Drilling and oil]. 12/2019, pp. 42–45.
3. Melnik I.A. Identification of oil and gas saturated in low resistance reservoirs based on determination of geochemical parameters according to reinterpretation of wells geophysical study results: autoreconstruct of the doctor’s dissertation: 25.00.10 / Melnik Igor Anatolyevich. Tomsk, 2014, 33 p.
Published with thanks to Gazprom Neft & PROneft Magazine
Authors
S.A. Andronov1, E.A. Gorenkova1, D.A. Ischuk2, I.A. Maksimenko1
1Gazpromneft STC LLC
2Gazpromneft-Zapolyarie LLC