Gazprom Neft: Reservoir Pressure Maintenance – Digitally Integrated Models for Water Injection Management
One of the Company’s highest strategic goals is to achieve an oil production rate of 100 million tons of oil equivalent. This goal requires an expanded resource potential, new oil fields being brought into production and enhanced production from the current wells.
At the moment, the Company has a reservoir pressure maintenance system (RPM) in place, in 95% of its fields. This system is a key element in oil field development while its health and operation is directly linked to the requisite reservoir operational factors and drive mechanisms, and, consequently, oil production. However, nearly all Gazprom Neft subsidiaries face issues of field data analysis and interpretation due to the lengthy and exhaustive process and the outcomes are not always clear. Thus it is not always apparent which part of the system, i.e. the formation, oil well or infrastructure, is causing the trouble.
We use a well-known equation for estimating oil recovery factor (1):
КИН=Кохв×Квыт, (1)
Where Кохв : Volumetric sweep efficiency
Квыт: Oil displacement efficiency
Кохв : Ratio of the connected reservoir volume swept by the injected fluid to the total reservoir volume. The volumetric sweep efficiency describes the relationship between discontinuity (alternating permeable and non-permeable formations) and filtration properties, i.e. a reduction in the producible volume in the formation compared to the absence of non-permeable zones.
A primary aim during development is to fully involve the reservoir volume in the production process. However, when the heterogeneity is high or the difference between oil mobility and the flooding medium mobility is greater, the efficiency of the water injection is diminished. This is evidenced by a drop in volumetric sweep efficiency. The main reason is caused by uneven injected water advancing across the formation area and into the depths.
Квыт: Is the ratio of the oil volume driven by water movement from a core sample or laboratory formation up to complete sweeping of the recovered core sample to the initial oil volume contained in the core sample or laboratory formation.
The oil displacement efficiency correlates with many factors and is not constant over the course of a reservoir’s production. The study of the oil / water displacement mechanism for the reservoir rock shows that such petrophysical rock properties as irregular pore space organization, pore size, specific area, composition and wetting characteristics of the reservoir rock along with the reservoir fluid properties, i.e. oil viscosity and composition, oil / driving medium interfacial tension, and temperature, all impact oil displacement efficiency.
A decrease in these underlying parameters of oil displacement efficiency due to the emerging issues results in an exponential base production shrinkage and missed oil recovery.
The major challenges to develop and manage water injection in an oil field include:
• Differences in voidage replacement (reservoir pressure differential within the water injection pattern, which has an impact on Квыт)
• Higher water injection in the wells
• Inefficient water injection.
The question is then: how to maintain and increase production by enhancing the water injection system?
An oil field is a complex balanced hydrodynamic system consisting of the subsurface portion of the well and its surface infrastructure. Each part of the system in the Company’s current properties is modeled separately, in order to eliminate any interaction between them. It may eventually lead to a bad decision making in development and may have irreparable consequences for the oil field. It is not possible to manage all systems online simultaneously.
To address this challenge, we will use an integrated modeling software. The RPM digital model brings the formation, oil well, and infrastructure together into a single system. When the operating conditions in any part of the system change, the differences in the operation of its other parts can be tracked. Mutual well interference is factored in. This model makes it possible to manage water injection in each individual well and also to track any portion of the single Cluster Pump Station (CPS)-Water Lines-oil Well-formation System down to each well-bottom hole, diagnosing the problems and identifying their best solutions. The model will assist in determining an adequate injection flow-rate and selecting suitable well-head and down-hole equipment for each well.
During consolidated modeling, the development geologist and process engineer work together in a cross-functional team. The development geologist assumes the job of formation modeling, prioritizing the water injection patterns, scheduling interventions in the injection wells, and submitting the planned operations as a data basis to the process engineer.
Using the digital model, the process engineer evaluates the feasibility of these interventions, selects equipment (chokes, string), prepares a cost estimate for the operations, and returns the compiled results to the geologist. After a few iterations within such synergistic collaboration, we obtain the result at the end:
• Activities to improve the RPM system’s operation
• Increase in hydrocarbon production
• Reduction in useless water injection
• Selection of the infrastructure operating conditions for cyclic water injection
• Comprehensive support for water injection management
The Sugmut Field Cluster was selected for the pilot project. 4 cluster pump stations (CPS) are used to inject the injection fluid in the RPM system in the Sugmut Field Cluster. The KNS-1; 2 pumps are for the north of the field and the KNS-3А; 3B pumps are for the south of the field. Furthermore, the latter are connected within a single high pressure water line system. It was decided to pilot-test the cluster pump station (CPS)-water lines-oil well-formation digital model in a separate area within the RPM system. The KNS-2 RPM system coverage area was selected as a pilot section. 2 pumps with throttle control are operated in the pump station. There are currently 57 injection wells (Fig. 1).

Based on the modeling results, the model proves to be highly accurate against the actual operating results. The discrepancy between the estimated and actual parameters is not greater than 5%. However, the model analysis showed some inconsistency.
The model was examined through a multi-step process:
• Step 1: Integrated model calculation for the wells
• Step 2: Well shut-in and conventional hydraulic analysis up to the well head
• Step 3: Result comparison and analysis. If the results are similar, then the issue lies inside the infrastructure. If there are any discrepancies, then the issue is in the well. The well operation history needs analysis.
The model calculation for the pilot area revealed the following discrepancies:
• Direction and cluster group at a pressure below the design goal due to the choke flow area
• 2 wells had lower reservoir pressure. This was caused by the activities carried out to reduce water injection and adjust injectivity; as a consequence, void age replacement within the pattern fell below the required level
• 2 wells had inefficient water injection resulting from a leaking production string
• 16 wells with a packed perforated interval
• 3 well with potential scale build-up on the string walls
In this way, the field data analysis and digital model is capable of revealing any discrepancies in the RPM system operation remotely from the field. Their repair should be considered a priority.
The wells in the Sugmut Field Cluster were analyzed in collaboration with a task group from the reservoir and petroleum engineering function. They identified the area where the system components best facilitate each other’s operation (Target). They also detected the wells away from this area. The well position inside the chart helps predict where the issues will arise: cluster pump station, water lines, oil well or formation (Fig. 2).

The clusters were divided through calculation into 5 classes. The horizontal line on the chart is an average well-head pressure (Руст) for the item under analysis as a whole while the vertical line represents a perfect match between the reservoir (Pпл) and hydrostatic head pressure (Pгс). The bubble size corresponds to the cluster production ranking in the last month.
• Class 1: The area where well-head injection pressure perfectly matches the reservoir pressure. The Target area
• Class 2: Well-head pressure is above average, while reservoir pressure is low. The candidate wells for the pressure maintenance program and bottom-hole treatment in the injection wells are to be selected. This provides conditions for the selection of candidate wells based on current oil rate and water cut.
• Class 3: Well-head pressure is below average, and reservoir pressure is low. The clusters for raising Руст are to be identified, and an oil production increment is to be assessed.
• Class 4: Well-head pressure is above average while reservoir pressure exceeds hydrostatic head pressure. The candidate wells for pump improvement are to be selected, and an oil production increment from attaining the target and minimum bottom hole pressure (Рзаб) is
to be assessed.
• Class 5: Well-head pressure is high at a reservoir pressure above hydrostatic head pressure. The clusters for water injection reduction are to be identified.
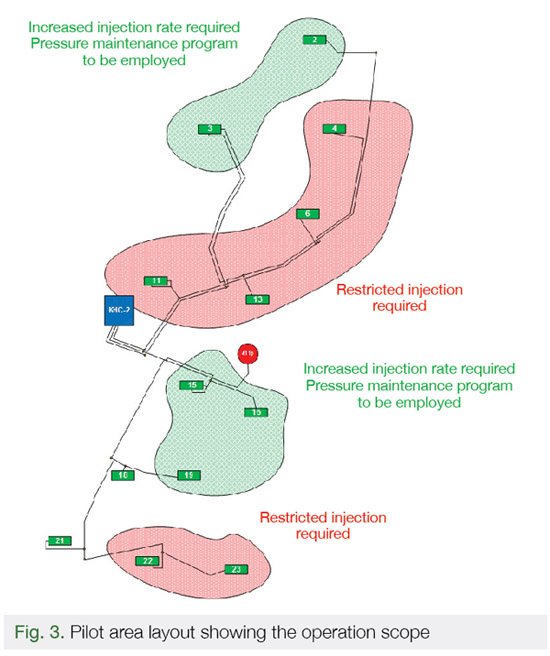
This classification formed the core for water injection restriction operations and initiating pressure maintenance program in the wells inside the pilot area. Clusters 2, 3, 15, 16, and 19 fall under class 2 where the cluster area is under-injected, and the candidate wells for the pressure maintenance program are to be considered. Clusters 11, 13, 6, 4, 22, and 23 are listed as class 5 where water injection is to be restricted.
If all wells in the Sugmut Field Cluster shift to the Target, an additional oil production of 6.8 million tons would be add over 25 years.
The model generated enhancements do not require any considerable capital investment and may be implemented within the company’s normal routine:
• Choke selection
• Including wells for pressure maintenance
• Well simulation
• Well decommissioning if water injection is inefficient
• Optimizing pump operation in the CPS
We have assessed the financial benefits from the efforts. Given the shipping, preparation, and power costs in the first 5 years, an annual NPV is around 500 million rubles, declining to a minimum at the end of the calculation period. The cumulative 25-year NPV is 9.5 billion rubles.
Conclusion
• We have generated a comprehensive model.
• Based on the model, we have developed strategies aimed at optimizing equipment operation and adequately balancing voidage within the water injection pattern, thus driving the earlier trapped oil into the well:
• Reservoir pressure change in the fluid flow simulation
• Bottom-hole formation treatment in 16 wells
• Well response increase through bottom hole treatment
• Pump operation improvement
• The implemented strategies will make it feasible to increase oil production by 6.8 million tons from the Sugmut Field Cluster, thereby increasing productionby 20%.
• We therefore propose spreading this method across the Company.
References
1. Surguchev M. L. (1985). Secondary and Tertiary Oil Recovery. Moscow: Nedra
2. Lysenko V. D. (1996). Oil Field Development: Theory and Practice. Moscow: Nedra
3. Vasiliev G. G., Korobkov G. E., Korshak A. A. et al. (2002) (Vol. 1). In Baynshtok S. M. Oil Pipelines (2 vols). Moscow: Nedra Biznessentr
4. Chikin V. V., Nilov R. V., Islamov I. I. et al. (2015). Pump Selection Criteria to Increase the Energy Efficiency of Reservoir Pressure Maintenance System. Moscow: Neftyanoe Khozyaystvo, 12
5. Shevelev M. B., Onegov A. V. et al. (2013). Summarized Results for Cyclical Water Injection: Case Study of Western Siberia Oil Field. Moscow: Neftyanoe Khozyaystvo, 1
Authors of the article:
Konstantin Povyshev, Gazpromneft NTC LLC,
Deputy Manager, Large Project Engineering,
Concept Design;
Rinat Valiev, Gazpromneft NTC LLC,
Manager, Concept Design;
Mikhail Rechkin, Gazpromneft NTC LLC,
Chief Specialist, Production, Concept Design;
Rinald Khamidullin, ITSC LLC,
Managing Director
Published with thanks to Gazprom Neft & PROneft Magazine