
Gazprom Neft: The Research and Experience of Applying Water Huff & Puff Technology in a Tight-Oil Reservoir

Introduction
There are a number of different challenges associated with the development of oil fields with low permeable reservoirs. One of them is the low efficiency of the formation’s pressure maintenance system, when producing wells have no reaction to water injection, which reduces the oil recovery factor. One of the fields developed by Gazprom Neft is used as an example in this article. Wells, penetrating such reservoirs, have low oil flows and high depletion rates, resulting In multiple wells within the field that operate with flow rates that are lower than 5 tons per day. Such wells are often converted to injection wells, since their production rates drop below the level of economic viability. In some cases, the wells were converted back into production well stock for certain technological reasons. The analysis of such conversions revealed that after a well was brought back to production its flow rate remained at a base level. A similar effect was discovered by some foreign researchers as well [3, 9], whereafter multiple laboratory tests and pilot projects were conducted. This technology received the name of “Huff and Puff”. It is a cycle consisting of three phases as follows:
• Water injection into a producing well (the Huff phase);
• Well shutdown for a short period of time — within a month;
• Bringing the well back into production (the Puff phase).
The Physics of the Process
The technology is based on the fact that over a half of pore spaces remain closed in a low permeable reservoir, since the pores are very small in size. If it is a hydrophilic reservoir, oil can be recovered using water capillary imbibition. Capillary pressure, responsible for the imbibition, can be defined using the following formula:

Where 𝛤c is capillary radius, Ơ – is capillary tension, 𝛳– is contact angle, Pk – is capillary pressure.
It is also known that capillary pressure is the difference in pressure values between the oil and water phases. That is the potential energy of a capillary micro channel is spent by the capillary force to lift water to a certain height.
As is seen in Formula 1 the shorter the capillary radius, the higher the force of the water in the hydrophilic capillary pore that replaces the oil. Since the size of a capillary channel is very small, the capillary pressure would be tens of times higher than the common formation depression which enables the water to replace oil in the sub capillary pores.
Since using a formation pressure maintenance system in low permeable reservoirs is inefficient, wells are usually operated with the minimum of water cut, hence it follows that capillary imbibition has no potential to start. To start it, one needs to inject a certain amount of water into the well. The basic risk is a decreased phase of permeable oil in the bottom-hole formation zone, and for a successful application of this technology it is necessary that the volume of the oil replaced from the sub capillary pores is higher than oil losses caused by changed phase permeability in the bottom-hole formation zone.
The Worldwide Application Experience
The mathematical simulations for some fields in China [5, 9, 10] demonstrated the efficiency of this technology with water injections. The experimental Huff and Puff projects, using core samples from China’s Changqing field with nuclear magnetic resonance logging, just confirm that. The article [6] presents the results of the pilot project at the Yanchang field whose properties are almost identical to the field under our consideration. As a result of the pilot project, the oil flow rate increased by 80% just using a single cycle of injection. The article also presents successful pilot operations carried out at the Niujuanhu and Toutai a Tahe fields.
FOR THE FIRST TIME IN RUSSIA, THE HUFF AND PUFF TECHNOLOGY WAS APPLIED. IN SPITE OF THE LACK OF DESIRABLE EFFECT, RESEARCH MUST CONTINUE AND PILOT PROJECTS SHOULD BE CONDUCTED WITH SPECIAL EFFORT MADE TO CONTROL FORMATION PRESSURE.
The core analyses from various American fields [7] using this technology showed better efficiency when surfactants were applied. The projects [2, 4] presented comprehensive analysis of applying Huff and Puff technology. The use of this technology at the US field in the North Dakota [1] did not produce any results, with the same outcome at the Parshall Field [3], however these reservoirs were not hydrophilic fields.
Therefore, in spite of the lack of desirable effect at the US fields, China’s application experience showed that incremental oil production was obtained in all of the cases. Failures at the US fields may have been caused by the hydrophobic nature of their reservoirs, which stipulates the use of surfactants, and possibly by insufficient well shutdown time frames.
Hydrodynamic Simulation
To conduct the pilot project, it was necessary to define the most effective modes of operation and phase timing, since both the duration of injections and shutdowns have a significant impact. To achieve this, a synthetic hydrodynamic model of a well was built using the tNavigator software.
To speed up the computation process it was decided to simulate just a quarter of the formation only. Thus, the flow rate of a well should be multiplied by 4 to obtain a real value. The computational mesh of the model is a parallelepiped of 500×500 meters, and 10 meters thick.
The process of capillary imbibitions was calculated using the dual porosity and permeability model. Since we have a system of large size pores, where filtration takes place, and a system of small size pores, where filtration is missing, one can compare this with the following system – the matrix-fracture system, where the fracture means large size pores and the matrix is a system of small sized pores. To simulate a fractured reservoir, we have the dual porosity function, where the reservoir is simulated using two overlapping layers. The matrix is defined with a horizontal permeability of 0.045 – 10-3 mkm2, while the permeability of the fracture system is 0.45 – 10-3 mkm2.
Since the simulator does not make it possible to define an additional pressure gradient between the matrix and the fracture, caused by the capillary force, the only solution would be to transform this gradient into the lateral permeability change. However, it is impossible to increase permeability by the number of times equal to the additional gradient – it needs multiplying by the ratio of the depression values summed to the value of the initial depression without imbibition. To calculate the depression between the structures, a key parameter should be defined in the dual porosity model, which is the sigma-factor. It physically expresses the area of contact between the fracture and the matrix and it can be calculated using the following formula:

where Ɩx’ Ɩy’ Ɩz – are sizes of the block by axes
Since the two structures are evenly distributed inside each other, the sigma-factor must go to infinity, which would result in the infinite conductivity between the structures; however, the matrix is actually not involved in production and does not interchange fluid with the fracture. In case the sigma-factor is zero, the interchange between the phases would be impossible. Therefore, it is necessary to define it in such a way that the lag of the depression in the matrix structure could be seen relative to the fracture structure; therefore, the sigma-factor was set to 0.1.
Capillarometric studies were performed on the wells. It should be noted that the study stops with a set pore diameter value and the latest pressure value is recorded which is then assigned to all the pores with a smaller diameter. However, capillary pressure may reach greater values in the real world. To take it into account a correlation was built between the additional pressure gradient: a function was derived from the experimental research which was taken as a basis, and this was then extrapolated.
Further on, the recalculation was carried out relative to the water saturation and the pore diameter using the same methodology that was applied during the laboratory research. As a result, a mean pore diameter was assumed in the matrix equal to 0.07 mkm. with capillary pressure of 20 bar. This being the case, a function was defined in the simulator’s arithmetic, designed to multiply the matrix’s permeability when it passes the water saturation threshold. As a result, a graph of the relationship between the oil flow rate and timing was obtained and a graph of cumulative production, which are presented in Fig.1. Following the natural decline in oil flow rate due to the loss of reservoir pressure, water injection is carried out, and the well is shutdown for a soak treatment, whereafter the flow rate becomes three times higher, and the production rate is kept steady due to the oil withdrawn from the matrix, and then it planes down. To select an optimum injection condition and shutdown timing, multivariant calculations were carried out. The relationship between incremental oil production and injection timing with various well shutdown time frames is presented in Fig.2. It is seen from the graph that the maximum build-up of incremental production was observed during the first 10 days of injection, however such a time duration results in considerable costs due to the frequent changes in well operation, therefore 20 days would be the optimum period for well injection.


Implementation and Results of the Pilot Project
The pilot project was conducted at four wells. The candidate wells were selected from the wells that had been planned for conversion to formation pressure maintenance, which makes it possible to mitigate the risks of losses in oil production (the technology is applied on non-profitable wells with a minimum oil flow rate).
The conditions for well shutdown and injection were defined in accordance with the company’s capabilities to perform the run-in-hole/put-out-of-hole operations within the set time frames because of which two wells failed to deliver the cycles of injection and shutdown optimal for the experiment.
Table 1 presents the list of tested wells and the time frames of their shutdowns and injections.

Fig. 3 illustrates the graphs of daily well data, while Table 2 contains the key engineering parameters.

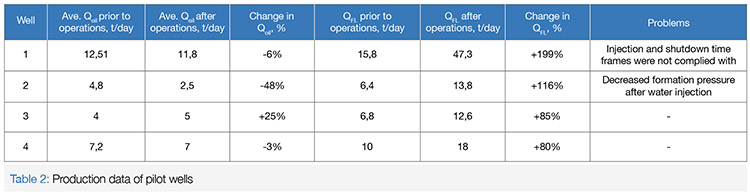
Of all the 4 wells where the Huff and Puff technology was applied, only Well 3 delivered inconsiderable desirable effect.
That said, formation pressure measurements performed at Well 2 showed that it was 97 atm before injection and it became 54 atm. after it, which is much lower than the value of the formation pressure. Such values might have been caused by the consequences of the capillary imbibitions, which is unlikely though.
Well 1 failed to deliver the optimum duration of phases. The real time frames of well injection and shutdown amounted to 3 and 1.5 months respectively. Therefore, it was possible to use Wells 3 and 4 for research. The first one yielded some desirable effect, the second one did not show any significant changes in oil flow rate.
When water is injected into a producing well, the relative permeability of oil formation pay zone usually decreases, and the initial oil flow rate as a rule declines with the follow up fluid withdrawal. This enables us to make an assumption that capillary imbibitions did have place in the wells under consideration, since oil flow rate did not change against the base flow rate.
It is also possible to conclude that a more durative shutdown period usually more positively results in oil flow rate, since Well 3 was shut down for one month, while Well 4 – just for 15 days.
References
1. Hoff man B. Todd. Improved Oil Recovery IOR projects in the Bakken formation. SPE-180270-MS.
2. J. O. Alvarez, F. D. Tovar, 2018. Improving Oil Recovery in the Wolfcamp Reservoir by Soaking / Flowback Production Schedule with Surfactant Additives. SPE-187483.
3. James A. Sorensen. Historical Bakken Test Data Provide Critical Insights On EOR In Tight Oil Plays.
4. James J. Sheng. Critical review of fi eld EOR projects in shale and tight reservoirs. J. Pet. Sci. Eng. 2017, vol. 159, pp. 654–655.
5. Jie Bai, Huiqing Liu. CO2, Water and N2 Injection for Enhanced Oil Recovery with Spatial Arrangement of Fractures in Tight-Oil Reservoirs Using Huff -n-puff . Energies 2019, vol. 12, pp. 823. https://doi.org/10.3390/en12050823
6. Li Zhongxing, Qu Xuefeng. Development modes of Triassic Yanchang Formation Chang 7 Member tight oil in Ordos Basin, NW China. Petrol. Explor. Develop., 2015, vol. 42(2), pp. 241–246.
7. Tadesse Weldu Teklu, Xiaopeng Li. Low-salinity water and surfactants for hydraulic fracturing and EOR of shales. J. Pet. Sci. Eng. 2018, vol. 162, pp. 367–377.
8. Ting Chen, Zhengming Yang. Waterflooding Huff -n-puff in Tight Oil Cores Using Online Nuclear Magnetic Resonance. Energies. 2018, vol. 11, pp. 1524.
9. Wang, D., Cheng, L., Cao, R., Jia, P., Fang, S., Rao, X., Dai, D. The eff ects of the boundary layer and fracture networks on the water huff -n-puff process of tight oil reservoirs. J. Pet. Sci. Eng. 2019, pp. 466–480.
10. Xiang Raoa, Linsong Chenga, Renyi Caoa A modified embedded discrete fracture model to study the water blockage effect on water huff -n-puff process of tight oil reservoirs. J. Pet. Sci. Eng. 2019, pp. 149. https://doi.org/10.1016/j.petrol.2019.106232
Published with thanks to Gazprom Neft & PROneft Magazine
O. Tsykunov1, I. Kaeshkov2
1SEC Gazpromneft-Polytech
2Gazpromneft-STC LLC