Greenfield Valuation: How to Reduce Initial Investor Risks?
Formulation of the Problem
Extracting hydrocarbon resources are exceedingly difficult projects for early stage investments. This is due to the high level of uncertainty that the investor faces when deciding whether to enter a Greenfield project. Investors often do not know how to approach their assessment, do not always fully understand the prospects and risks associated with the development of deposits, and have a limited amount of geological data.
The website of the Federal Agency for Subsoil Use «Rosnedra» and the official website of the Russian Federation post bidding information which contains brief information about the licensed areas put up for auction – administrative and geographic location, area of the site and information on the resources and reserves.
To decide whether or not to participate in the auction, the future subsoil user needs to collect and analyse the exploration data for the territory. For this, companies or individuals, apply to the geological information territorial fund. As a result of long and painstaking work, a potential investor accumulates a package of geological information, including data on regional tectonics, characteristics of the main productive complexes and formations, averaged reservoir properties (hereinafter referred to as reservoir properties) of reservoirs, and reserves in neighbouring fields.
The thorny path of the investor, as well as the conclusions that they can come to after studying the available information, is most conveniently illustrated with a specific example.
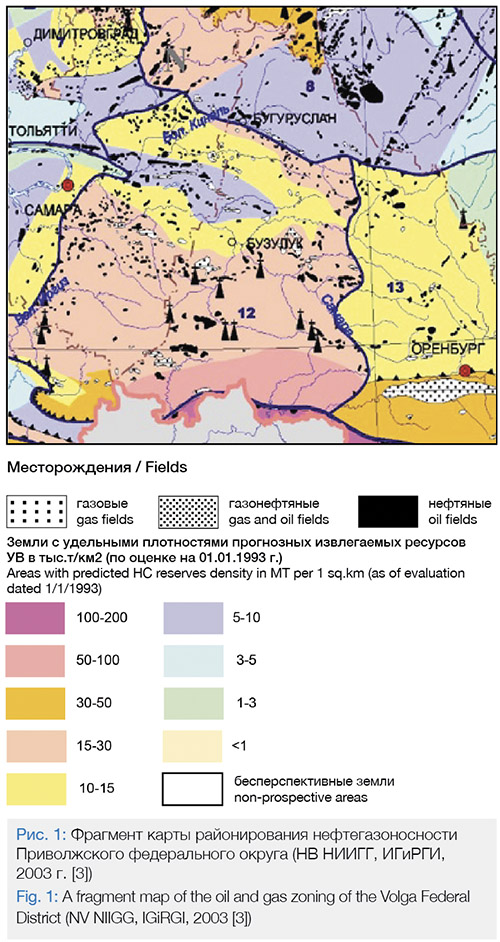
As a possible target region, we will consider one of the main oil and gas producing regions of Russia – the south-eastern section of the East European platform, which is part of the Volga-Ural oil and gas province (hereinafter – NGP). The region is well explored. In published articles and monographs [1,2], as well as in the territorial funds of the Samara, Orenburg and Perm regions, a huge amount of geological and geophysical information about the region has been accumulated.
In the south-eastern sedimentary section of the East European platform, around two thousand (!) Oil and gas-oil fields have been identified in terrigenous and carbonate deposits of the Devonian, Carboniferous, and Permian systems. The region is distinguished by its very high density of hydrocarbon resources – from 10 to 100 thousand tons / km2 (Fig. 1). The main share of the deposits falls on the Lower Devonian-Frasnian, Tournaisian and Visean-Bashkir complexes. A significant part of these deposits are multilayered. The main objects for development for most of the fields are the productive stratas of the terrigenous Devonian and carbonate stratum A4 (Bashkirian stage of Carboniferous deposits).
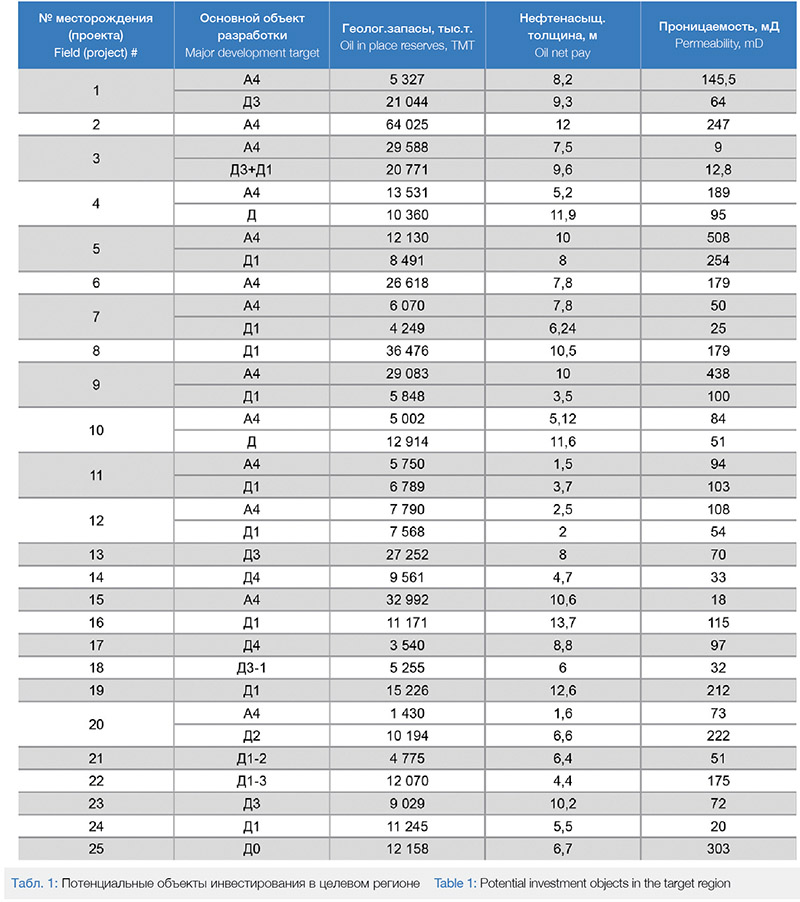
We will assume that a potential investor makes a decision whilst having basic geological and geophysical information on 25 fields in the target region that have one or two development targets – terrigenous Devonian strata and A4 carbonate stratum (Table 1).
Hereinafter, the authors of the article used open sources, as well as their own databases and expert assessments of the Ingenix Group LLC (hereinafter – Ingenix Group).
The investor’s task is defined quite simply as: how, using this information, can you choose the most effective project for investment?
Analysis of the Geological and Reservoir Characteristics of the Target Region
Studying the initial information, the investors geological team will come to the conclusion that up to 17 industrially productive layers have been identified in the Lower Devonian-Frasnian predominantly terrigenous complex in the Volga-Ural oil and gas field. The most significant among them are terrigenous layers D0-D7, the so-called «terrigenous Devonian». In the considered potential projects, formations of the D4-D0 group are being developed.
Reservoirs of formations D4-D3, as a rule, are represented by gray, more often fine-grained sandstones (for example, at field No. 17), however, there are also medium-coarse-grained varieties, with individual interlayers of gravelites (at deposits of the Zaikinskaya group).
The porosity determined from core data varies in the range from 9% (field No. 14, reservoir D4) to 20% (fields of the Zaikinskaya group, reservoir D3), reservoir permeability varies within wide limits – from 12.8 to 890-900 mD. Among the test fields, the highest permeability of the D4 Ardatov sandstones (97 mD) was found at field No. 17, located within the western flank of the Buzuluk depression.
Layers D1 and D0 are identified in the Upper Devonian Pashiian horizon. Sediments accumulated in shallow-sea conditions and on coastal plains. Figure 2 shows the average weighted oil-saturated thicknesses of the Pashi horizon in each of the considered fields, as well as data on the permeability and volume of geological reserves.
The spreading (expanding) areas of the layers increase from the bottom to the top. The lower layer D1-2 is developed in the western part of the Orenburg and eastern parts of the Samara region. Layers D1-1 and D0 are distributed practically throughout the southeast of the East European platform. Relatively higher reservoir properties (net oil pay, or Nef, permeability) are characteristic of reservoirs in sediment accumulation zones with an increased proportion of sand fractions. The arrows in Fig. 2 shows the direction of removal of sandy material from land.
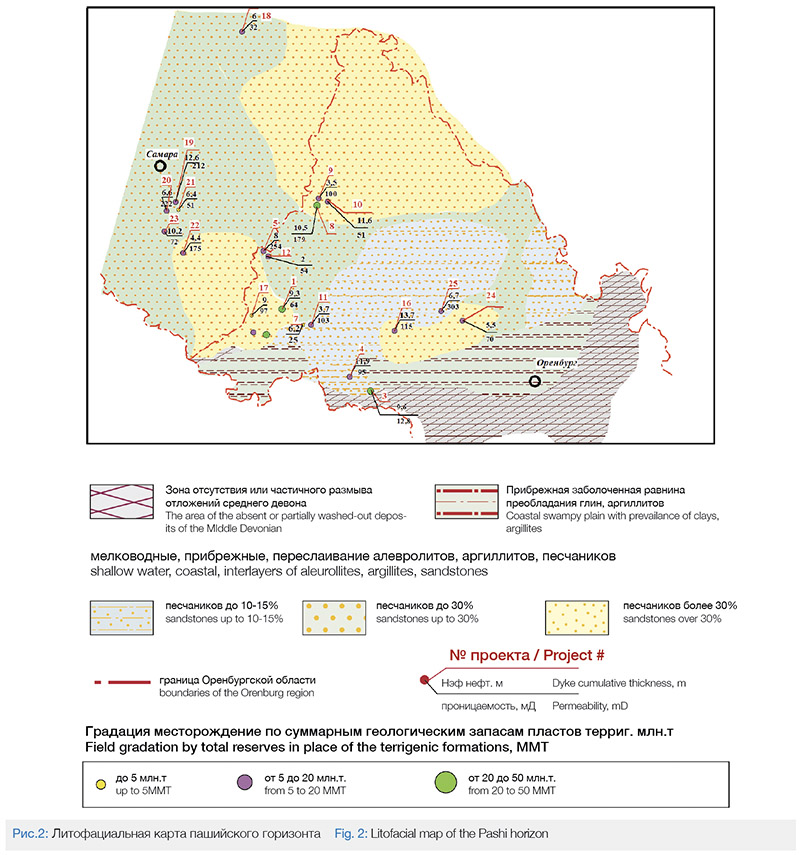
The D1-1 stratum has the largest share of sandstones. The effective thickness of the reservoirs in some wells reaches 20-25 m. Sandy interlayers of the D0 formation usually have a thickness of 2-3.5 m, reaching 7 m in sections (for example, at field No. 25).
Reservoirs of D1-1 and D0 formations have the highest reservoir properties. The porosity varies from 9% to 31%, the permeability reaches 961 mD in some fields of the Samara region [2].
The above analysis can be summarized by assuming that the investor, when choosing the best of the alternatives, will face significant variability in the main geological characteristics of the terrigenous Devonian strata in the selected region, which, in turn, determine the production rates of wells during development and, in many respects, determine its efficiency.
Let us further consider the investment attractiveness of the Bashkirian stage for an investor at this stage.
The main productive object – the A4 layer of the Bashkir age (Fig. 3) – has a regional distribution and is generally characterized by a high potential for productivity. Relatively large and medium-sized deposits tend, as a rule, to areas of increased thickness of Bashkir deposits (for example, at deposits No. 6, 9, 15). However, even along the periphery of the zone of reduced thicknesses, separate reef objects can form (as in deposits Nos. 2, 3). In addition to reef objects, the A4 bed is characterized by traps associated with pre-Vereya erosion, i.e. traps screened by stratigraphic and lithological unconformities. The rocks of the Bashkirian stage themselves are favourable for the creation of pore capacity, because they are often represented by organogenic limestones. But an important role belongs to the reservoirs which have a secondary capacity, formed as a result of the outcropping of rocks to the surface and the impact of eroding factors. This is associated with the high variability of reservoir properties of sediments.
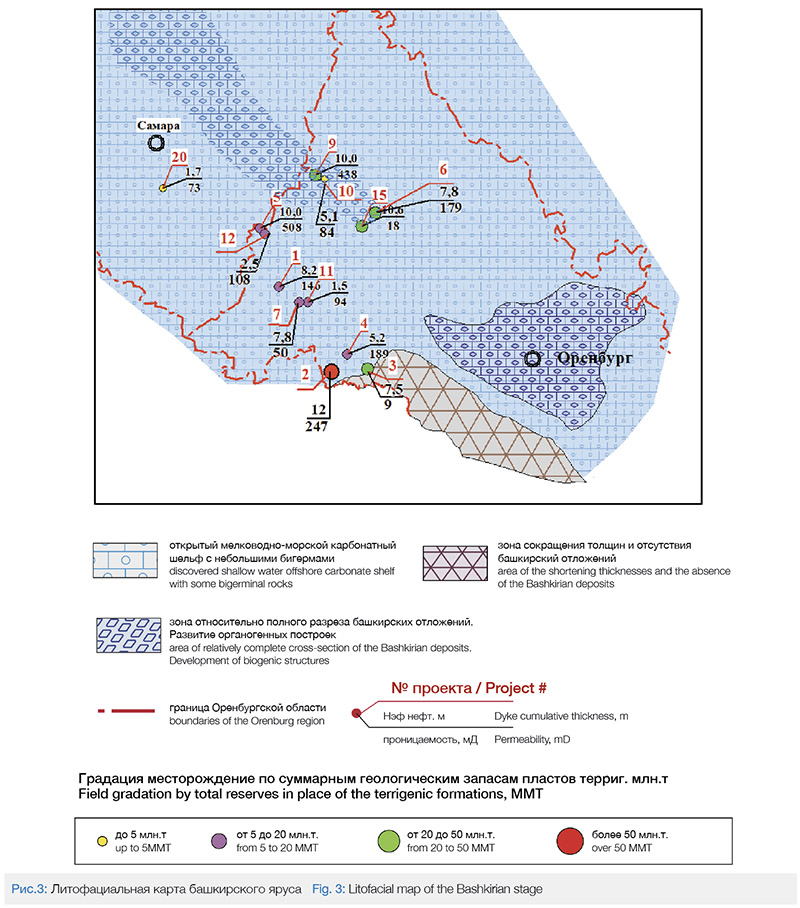
The permeability of carbonate reservoirs in some of the fields have high values – up to 788 – 800 mD. Deposits of the A4 formation are distinguished by high productivity, production rates that can reach 560 m3 / day. [1]
As a rule, highly permeable reservoirs of the A4 formation are typical for the areas located in the side zone of the Mukhanovsko-Erokhovsky trough, on the border of the Samara and Orenburg regions (projects No. 5 and 9) (Fig. 3).
The average value of permeability in the fields of the Mukhanovsko-Erokhovsky trough is 300-400 mD. Moving away from this zone the reservoir properties deteriorate. The average permeability of A4 reservoirs is 160-180 mD.
There are sections of low-permeability reservoirs of the A4 formation – in the east of the Buzuluk depression, in the junction zone of the Buzuluk and Caspian basins. At field No. 3 in the side zone of the Caspian depression, the average permeability is only 9 mD.
Thus, the wide variability of the main geological characteristics of this group of formations using the example of the presented fields also does not allow the investor to unambiguously determine the best investment targets.
To solve the problem of choosing investment goals, it is necessary to initially involve a multidisciplinary team of experts (which is not always possible and impractical due to the large labour costs), or to automate the initial process of assessing deposits.
Such an IT tool should make it possible to carry out an express calculation of the full development cycle of a field (from geology to economics), which will allow generalizing heterogeneous geological information and presenting the result in the form of the net discounted income (hereinafter – NPV or NPV) of the investor. For this it is necessary to assess:
• systems for the development of multilayer oil fields, taking into account the reference book of reservoir characteristics (reservoir properties) and oil properties typical for a particular region;
• field drilling programs that determine the dynamics of the well stock;
• a conceptual scheme for the development of the oil field with the selection of facilities with the required technical characteristics;
• the cost of construction and operation of wells and infrastructure facilities using regional databases of the costs of typical facilities;
• investment efficiency indicators.
General Description of the Methodologies Underlying the Rapid Assessment Tool
An automated software package developed by Ingenix Group allows for an express assessment of the development of an oil field from «geology to economics» (Fig. 4):
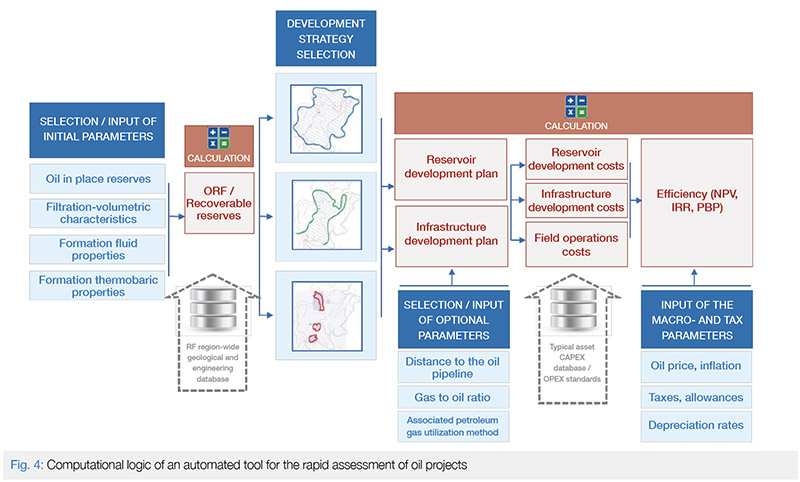
At the first stage, the development indicators are calculated according to the given design solutions, depending on the reservoir properties of the productive layers. The initial parameters are set from the geological reference book depending on the target region and reservoir. The handbook contains data on the depths of amalog reservoirs, pressures, reservoir properties, as well as the properties of reservoir fluids at reservoir pressure and temperature. The development design within one field and the calculation of production indicators can be carried out for one, two or three development objects with sequential or simultaneous commissioning.
For each of the objects, the following development scenarios can be considered: aggressive, efficient or rational. The «aggressive» option assumes putting into development the best areas of the development object, the coverage of reserves is ~ 40%. The «effective» option involves putting up to 80% of the reserves into development without drilling out the edge zones. The «rational» option assumes full drilling and commissioning of all 100% of the facility’s reserves. The rate of drilling out and the rate of withdrawal are set depending on the development option and are adopted by analogs. Each of the objects is drilled out with an independent well grid with a selected type of well completion, from the proposed: directional wells (hereinafter referred to as NPS) and horizontal wells (hereinafter referred to as horizontal wells). Fracturing stimulation can be applied to every completion type, including multi-zone. The calculations are performed for a 25-year period.
In general, for each field, the technical development indicators are obtained by summing for each development object.
Based on the requirements for the technical and technological characteristics of the facilities, formed at the stage of calculating the development indicators, the IT complex is forming a field development scheme, which includes the following:
• calculation of the number of clusters taking into account the well production radius;
• calculation of the length of the oil gathering system, taking into account the production from one pad and the area of the field;
• determination of the capacity of the main facilities, taking into account the production level and the presence of a reservoir pressure maintenance system;
• selection of gas infrastructure facilities depending on the chosen method of associated gas utilization;
• determination of the capacity of the external oil pipeline (the length is set in the initial parameters;)
• determination of the necessary auxiliary facilities (shift housing, roads, power lines, other facilities).
Further, on the basis of the database of the values of analogous objects and cost models, the capital costs for the development of the field are calculated. Operating costs are calculated automatically depending on the production profile, the number of wells and the availability of facilities. For the selected objects, on the basis of their commissioning schedule, profiles of capital and operating costs are formed, respectively.
Based on the technical and cost characteristics of the project, as well as user-entered macro parameters and data on the tax environment of projects, the calculation of economic efficiency is carried out, as well as sensitivity analysis.
Results of Appraisal of Deposits in the Target Region
For the selected region, calculations of technological development indicators were performed using a software tool according to the method described above.
As a baseline for a comparative assessment, a «rational» development option was calculated for two objects – layer A4 of the Bashkirian stage and layers D0-D4 of the terrigenous Devonian. For the objects of the terrigenous Devonian, drilling of horizontal wells was envisaged, for the A4 of the Bashkirian stage – (due to its high index of dissection).
For the terrigenous Devonian objects, the conductivity values were determined in the range 108-2671 mD * m, witaverage value of 854 mD * m, the values of hydraulic conductivity are in the range 43-2428 mD * m / cP, with an average value of 912 mD * m / cP. For these characteristics of reservoir properties, the values of recovery factor were obtained from 0.314 to 0.512 with an average value of 0.421. The range of specific oil production per well is 70-599 thousand tons. The average specific oil production per horizontal well was 288 thousand tons.
For object A4 of the Bashkirian stage, the conductivity values were determined in the range 68-5080 mD * m, with an average value of 1263 mD * m, the values of hydraulic conductivity are in the range of 30-5404 mD * m / cP, with an average value of 1068 mD * m / cP. For these characteristics of reservoir properties, the values of recovery factor from 0.198 to 0.486 were obtained with an average value of 0.357. The range of specific oil production per well is 47-217 thousand tons. The average specific oil production per one directional well was 110 thousand tons.
With the given parameters, a number of conditions were admitted that are uniform for all the fields being evaluated:
• fields with two layers (development targets) have an overlap coefficient between layers of 0.55;
• the second development facility is commissioned two years after the first;
• associated petroleum gas is flared, in the model z
When determining the length and parameters of the oil pipeline, Ingenix Group experts proceeded on the assumption that the marketable oil would be accepted into the Transneft system for further transportation at the nearest operating oil pumping station.
The results obtained showed that for terrigenous formations with better reservoir properties, higher oil recovery factors and specific production per well are achieved. For carbonate reservoirs of the Bashkirian stage, drilling deviated wells will bring lower specific production per well and lower oil recovery factors.
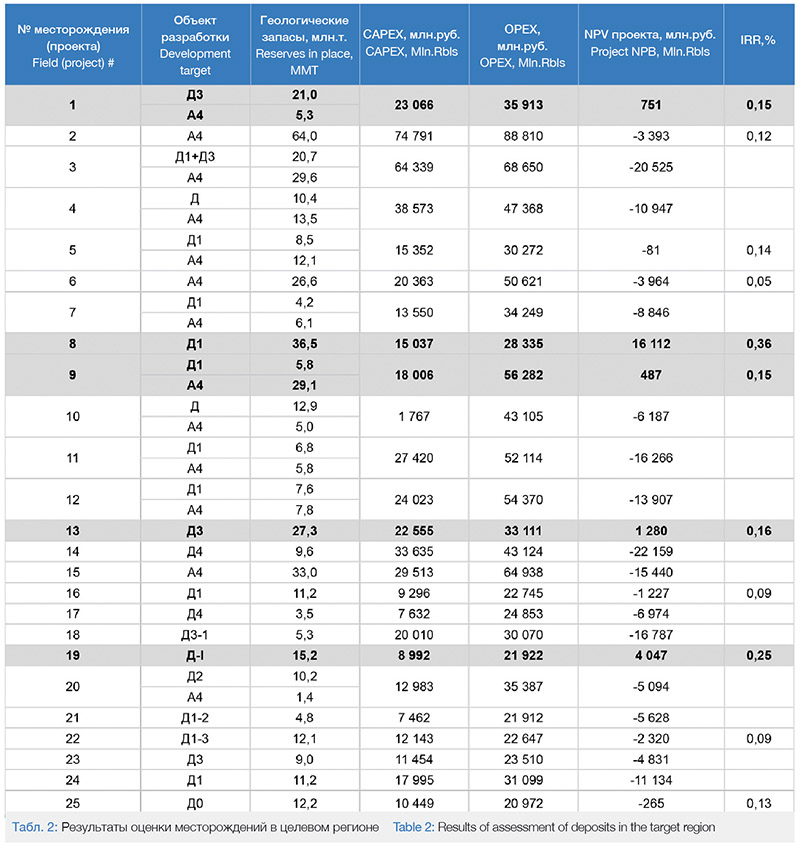
The results from the target deposits using the IT system are presented in Table 2. The analysis highlighted five economically attractive assets for further consideration. The remaining potential assets are not profitable for independent development, however, they can be considered as satellite fields for neighboring more efficient fields. This possibility will be described later in the article. You can also highlight projects that are on the verge of profitability for further optimization (for example, projects No. 5, 16, 22, 25).
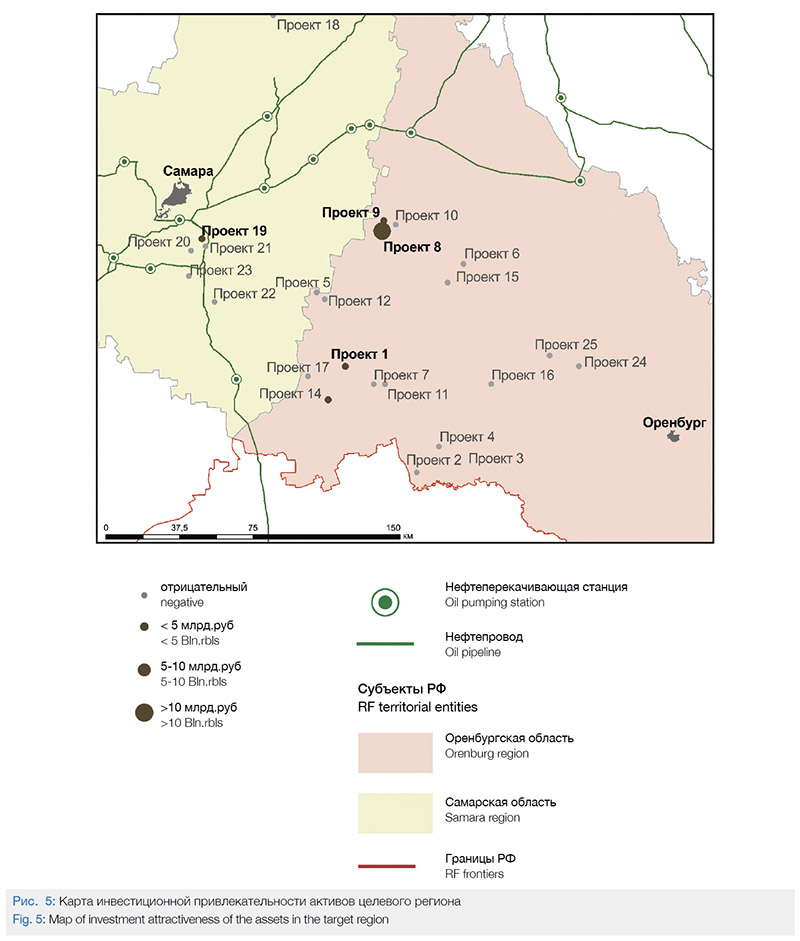
You can more clearly compare the attractiveness of potential investment targets on the map of the target region (Fig. 5).
It is important to note at this stage, it is impossible to expect an IT system to assess the accuracy inherent in later development stages – the design stage and, moreover, drilling and field development.
If we follow the methodology of the International Association for the Development of Value Engineering, then any estimates at this stage correspond to Accuracy Class 5, which implies an error range of -50% / + 100% [4].
At the same time, the value of using the IT-system for assessing a full cycle proposed by Ingenix Group lies in the ability to conduct a quick comparative analysis of a large number of potential investment targets under uniform scenario conditions.
Thus, the above analysis shows the possibility, at an early stage of asset development, in conditions of limited access to information, to carry out a full pre-project express assessment of oil and gas projects, including, inter alia, an analysis of the following factors:
• size of geological reserves;
• area and depth of occurrence of productive strata;
• oil-saturated thickness and reservoir properties of productive formations;
• the chosen development system;
• gas factor and method of utilization of associated petroleum gas;
• the length of the external transport pipeline and the direction of marketing of commercial oil.
The map of the investment attractiveness of the region obtained as a result of a comprehensive analysis can serve as a guideline for a potential investor at the earliest stage of searching for possible development goals in a new, poorly studied region.
Selection of a Multi-Layer Field Development Option
Using the capabilities of the IT system, the investor’s team, already at the current stage, can also choose the most effective option for putting the selected multi-layer field into development.
To do this, they have the following tool set at their disposal:
• determination of the optimal terms for putting the fields into operation;
• choice of development scenario (“rational”, “effective” or “aggressive”);
• use of the best well completion method (HPS or horizontal wells, with or without hydraulic fracturing).
Suppose that, based on the corporate strategy setting, the investor has chosen project # 1 from projects with a positive NPV. This project has two development targets – layer A4 of the Bashkirian stage and layer D3 of the upper part of the terrigenous Devonian.
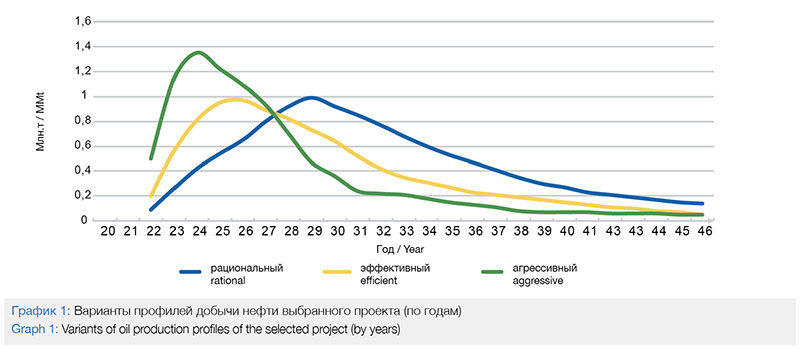
By judiciously using the functionality of the automated system, the investor team can calculate, for example, the following three development scenarios for the target field:
• “rational” option: provides for drilling the terrigenous Devonian with horizontal wells, object A4 – NNS, while drilling is carried out uniformly along a creeping grid from known to unknown. All geological reserves of the development objects are brought into development. The commissioning date of the A4 object is five years behind the terrigenous Devonian.
• “effective” option: provides for drilling out of the terrigenous Devonian with horizontal wells, and object A4 – by NNS, while marginal zones with deposits less than 4 m thick are not drilled, 80% of the geological reserves of each development target are introduced. The term of commissioning of object A4 is three years behind the terrigenous Devonian.
• “aggressive” option: relatively “effective” option, only the procedure for putting objects into development has been changed – objects are commissioned at the same time, while 40% of the geological reserves of the development objects will be introduced.
The calculated oil production profiles reflect the scenarios applied by the investor (Graph 1).
Calculations carried out by the IT system (Graph 2) showed that the “rational” option for project No. 1 has the highest oil recovery factor (0.44), but at the same time has the lowest NPV (607 million rubles) and is the most costly: capital and operating expenses totaled 57.7 billion rubles. In the “effective” scenario with oil recovery factor equal to 0.36, NPV amounted to 2.9 billion rubles, and the total costs – 50.3 billion rubles.
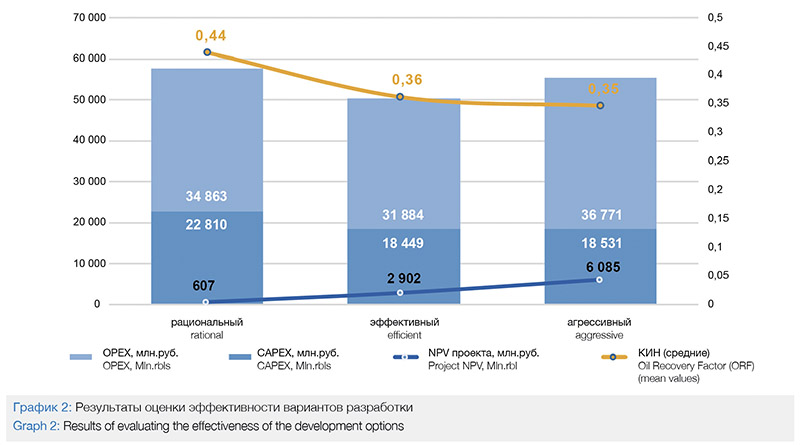
Considering the set of influencing factors inherent in the project chosen by the investor, the most attractive was the «aggressive» scenario: NPV – 6.1 billion rubles, total costs – 55.3 billion rubles. with CIN – 0.35.
Assessment of Synergy Potential from Joint Development of an Asset
In addition to analyzing options for optimizing reservoir development within one field, an investor can, using an automated system, assess the development potential of a portfolio of nearby fields, using synergy at the level of surface infrastructure systems.
Such an assessment allows a potential subsoil user to be more flexible when deciding whether to invest in a project (or projects) in the target region and consider not only single goals, but also their combination.
The synergy effect leads to optimization of the capacities of production facilities and, as a result, there is a decrease in the cost of their construction.
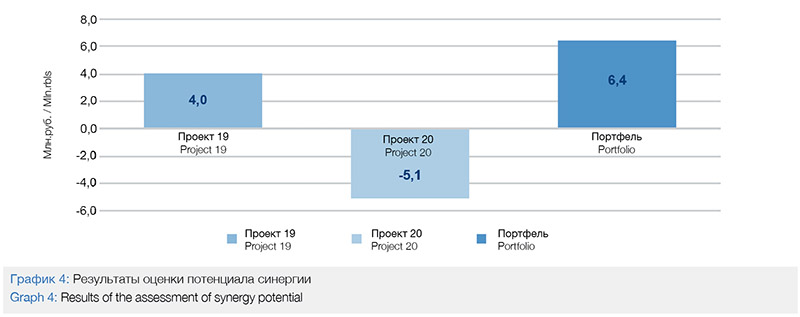
The potential for synergy can be illustrated, for example, when evaluating the option of joint development of project # 19 and project # 20 (Table 3 and Graph 3).
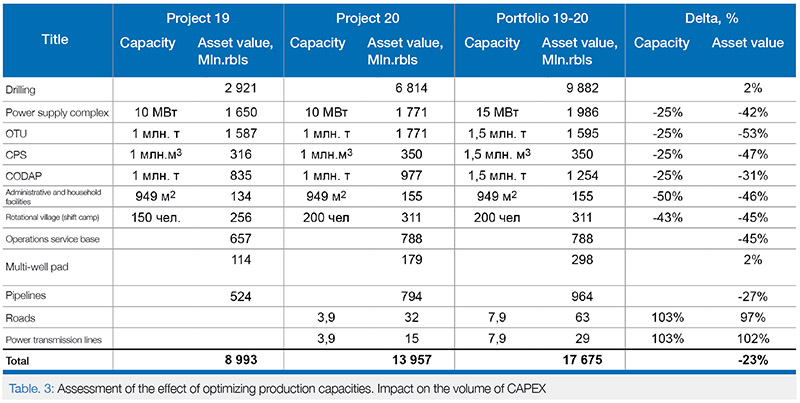
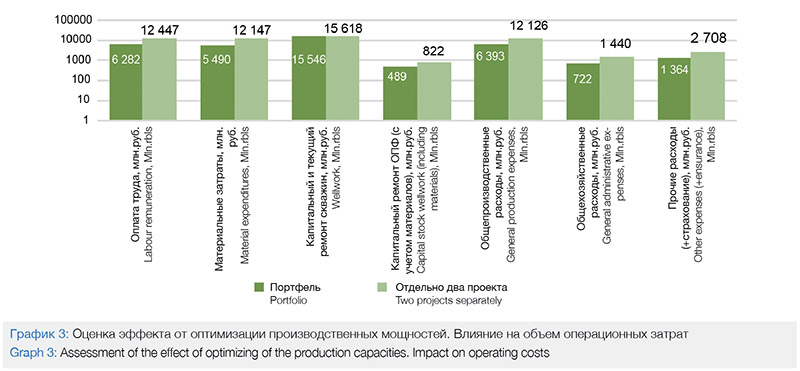
Thus, because of the creation of a single system of onshore infrastructure for both fields, the total capital costs are reduced by 23%, and the savings in operating costs reach 37%.
The achieved cost optimization cannot help but affect the results of evaluating the effectiveness of investments. So, if the initial assessment by the investor of the attractiveness of project No. 19 took into account the NPV amount equal to 4 billion rubles, and project No. 20 – minus 5.1 billion rubles. (Table 2), then the joint development of both assets can bring the investor already a positive net discounted income of 6.4 billion rubles. (graph 4).
Conclusions
Finding attractive oil and gas assets for investment is a difficult task for a potential investor who is not familiar with the potential region. This task requires searching and analyzing a large amount of information from disparate sources, as well as significant labour costs of a team of experts in various fields.
The proposed assessment tool, due to natural limitations, cannot be used for a full-fledged technical and economic assessment of projects (conceptual engineering) and, even more so, at the stages of design and preparation of fields for putting into production, but it is sufficient for solving a number of problems facing the future subsoil user at the decision making stage on the definition of the investment goals.
The use of an integrated IT system that combines a geological and cost database, as well as calculation models linked into a single algorithm, allows:
• for a comprehensive picture of the investment attractiveness of the region’s assets;
• choosing the most effective option for developing the target asset, and
• consider the possibilities of developing a portfolio of assets, using potential synergies for multiple developments
List of References
1. Geological structure and oil and gas content of the Orenburg region. Orenburg book publishing house, 1997
2. Shashel A.G. Geology and oil and gas potential of the Devonian terrigenous complex of the Samara Volga region. Moscow, 2000
3. A page on the Internet of the All-Russian Geological Research Institute. A.P. Karpinsky: https://vsegei.ru/ru/
4. AACE International Recommended Practice No. 87R-14, Cost Estimate Classification System – As Applied for the Petroleum Exploration and Production Industry. 2015, Morgantown, WV: AACE International.
Authors:
S.V. Chizhikov, E.A. Dubovitskaya, M.D. Fedorova, A.I. Kirillov, A.S. Sokolov