Ingenix Group: Calculating the Oil Field Development Parameters for Advanced Investment Planning

Advanced investment planning into a greenfield oil and gas project is impossible without a Technical and Economic Assessment (TEA) – produced from reserve estimates to economic analysis. That said, the shortage of sufficient G&G data and other information, at an early stage of advanced planning, deprives an investor of the possibility to implement a meaningful economic evaluation, which is often limited to examinations of the geological and technical parameters or an evaluation based on various multipliers. Alongside that, an investor often faces time shortages for even rapid analysis of all of the possible investment alternatives in a region.
As a rule, in such cases an investor resorts to expert evaluations, which is not bad in itself. However, specialists with relevant experience may be not available or they might be busy. The range of issues that need to be solved simultaneously, is sometimes too great for those granted terms. In that case, it would be rational to apply an automated software solutions to assess a project’s efficiency. In order to develop an automated computation systems, a wide range of tasks need to be solved, which are related to various professional disciplines (geology, development, construction, economics). That said, one of the key solutions for such systems is to compute the field development parameters (production profile) when you have limited
available data.
The article describes the method for evaluating the development parameters (production profile) of a field that had not been put into development (the so called “Greenfield”), which was developed by the Ingenix Group specialists in the process of developing a software system capable of rapidly assessing a field. The method was developed with first-hand experience of implementing technical and economic assessment projects, as well as having an enhanced understanding of the nuances of conceptual engineering in oil and gas fields.
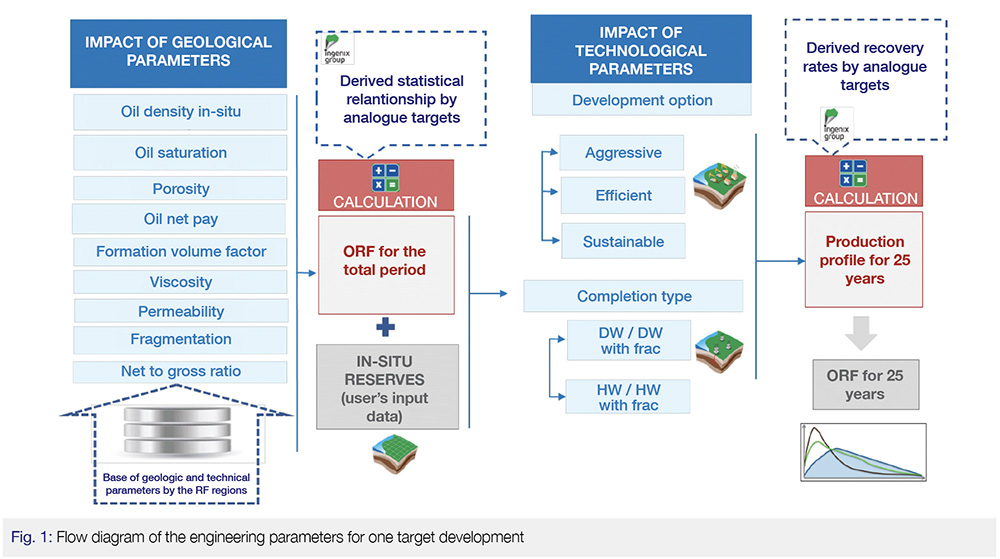
The calculation method (see Fig.1) consists of determining the oil recovery reserves using the oil recovery factor (ORF) based on the statistical relationships derived from the analogue fields and production profiles – as a percent of the recovery and oil displacement characteristics.
ORF Evaluation for the Total Development Period
The data for the analogue fields was obtained from reference literature and open-source materials. All of the key initial parameters (or hereinafter referred to as the changing geological parameters) have been consolidated into a Geological Database (GDB), which currently contains more than four thousand analogue data sets. The following geological parameters fall into variable categories: occurrence depth, oil bearing area, reservoir type, porosity ratio, oil saturation, net to gross ratio, compartmentalization of reservoir, formation pressure, temperature, as well as fluid properties: viscosity, density, gas content, formation volume factor.
ORF was determined for the total development period, using the module of multi-dimensional statistical relationships like:
ORF = f(Ni; Ci) – functional complexes,
Ni – reservoir properties, Ci– fluid properties, uploaded from GDB.
Statistical relationships for carbonate and terrigenous reservoirs were obtained using the latest data from analogue targets.
It is a fact that to provide the rationale for ORF, when analyzing recoverable oil reserves, the specialists of the State Reserves Committee quite often use the statistical relationships obtained from various authors and institutions which results in considerable data scattering of the parameters under certain conditions.
Let us consider, for purposes of illustration, a test field having the following changing geological parameters:
• original oil in place reserves – 44,5 МТ.;
• reservoir type – terrigenous;
• porosity 17%;
• average permeability – 15mD;
• average oil net pay – 5 m;
• oil saturation – 0.53 unit fractions;
• compartmentalization (number of sand beds) – 9;
• net to gross ratio – 0.41;
• oil viscosity in situ – 1,38mPA*с ;
• oil density in situ 864 kg/m3;
• water viscosity in situ – 1mPA*с .
One can conduct ORF estimations for the given geologic and physical conditions using the statistical relationships from various authors (Table 1):
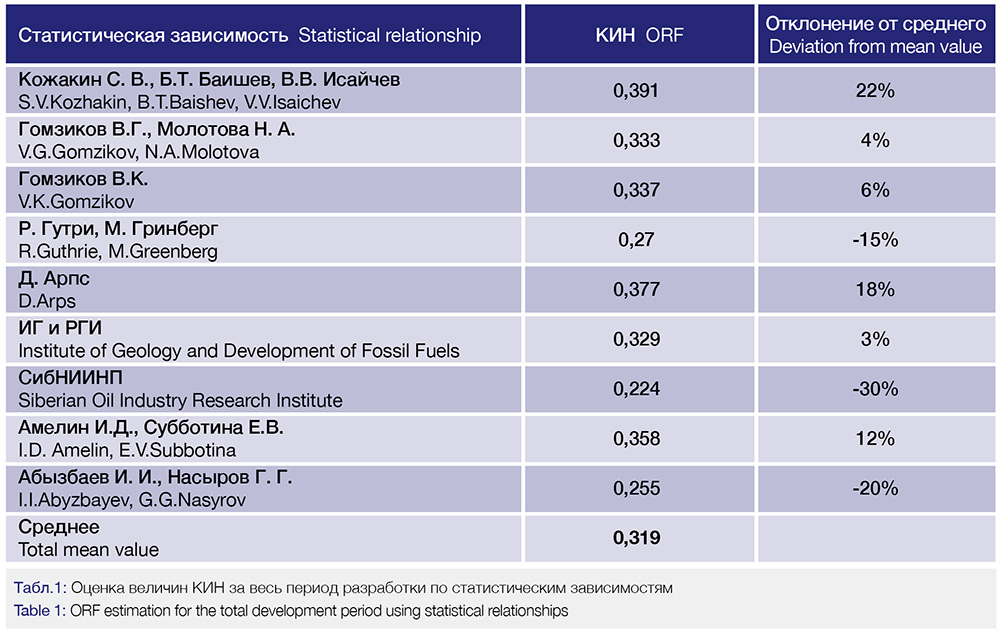
As it is seen from the table, the ORF values range from 0.224 to 0.391 (the mean value is 0.319, deviation from the mean value ranges from -30% to +22%). Data scattering, when estimating ORF using statistical relationships, is too great: for instance, when ORF is equal to 0.224, the recoverable oil reserves would amount to 9.9 MT, while with ORF equal to 0.391 they would be 17.3 MT already.
The automated system would provide the ORF estimation equal to 0.330 in this case. The authors’ approach to the ORF estimation also employs statistical relationships but it has two distinctive features that increases the reliability of the evaluation at the investment planning stage:
• Dependencies used in the Ingenix Cost Evaluator, were obtained using a vast number of analogue targets;
• Inferred dependencies, make better account of the key geologic and physical data and properties of the formation fluids.
The statistical relationships of many authors contain such parameters as net pay, permeability, relative viscosity etc., but those relationships were obtained in the 70’s-80’s using a limited number of oil fields having insufficient production history and no actually achieved ORF at that time.
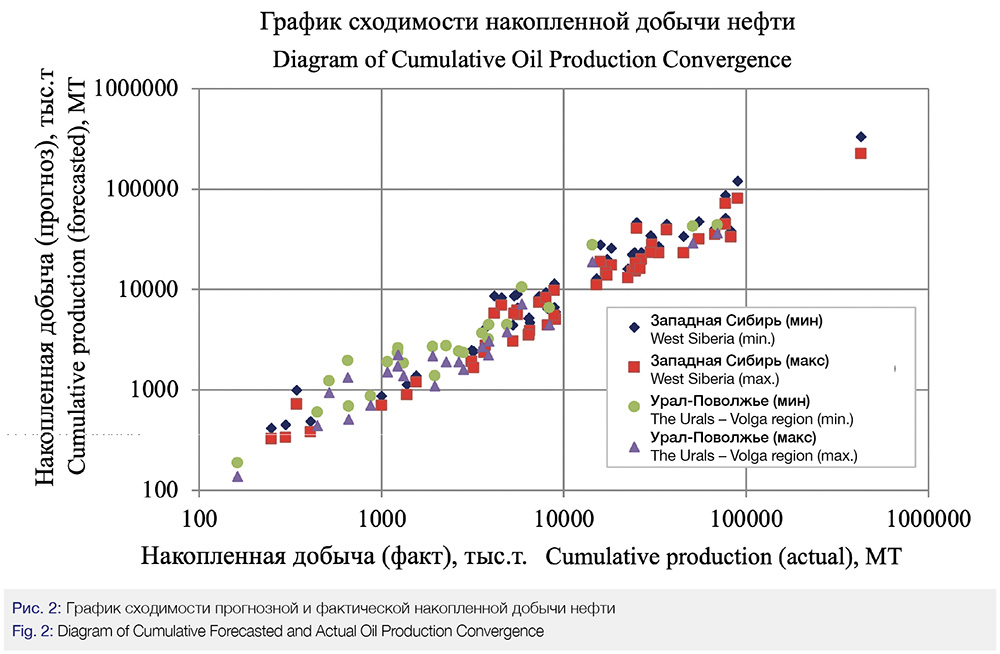
To achieve a good convergence of the forecasted ORF values with the actual ones obtained in the process of development under certain geologic and physical conditions, the key factors were singled out as having an effect on the achievement of the ORF values. A dependency was setup for the key parameters with a small fractional uncertainty. Thus, when entering the initial data from the analogue targets, we obtain the estimation of the ORF, very close to the ORF value, which was actually achieved on an analogue target. The forecasted example and the actual cumulative production is presented in Fig.2.
The Forecasted Rate of Recovery of the Development Targets and Production Profile of the Field
This calculation is carried out for a 25 year period. The growth in accuracy and realism of the estimates is achieved due to the increased quantity of the engineering parameters and their changing regulated values. They include the following:
• number of targets;
• field development plan;
• well completion type;
• field development start year;
• proportion of overlapped development targets;
• offset of target development start points relative of each other.
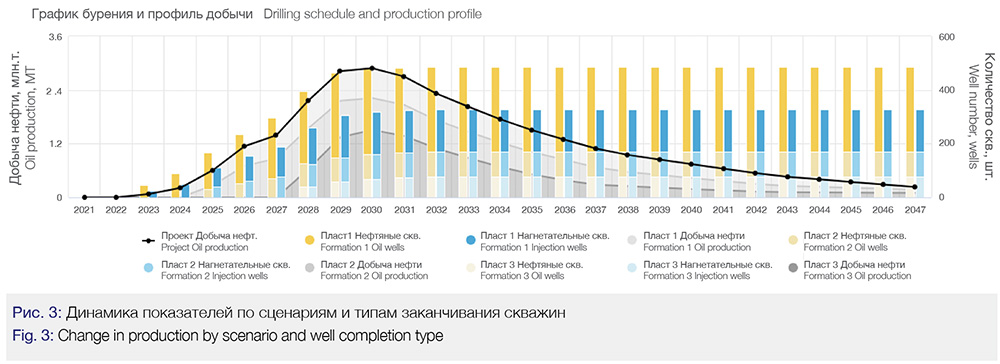
The possibility of involving several targets into the assessment of engineering parameters, yet at the early stage, is sufficiently important to maintain the realism of the evaluation. It is also assumed that each of the targets is developed using an individual spacing pattern (Fig.3).
The following development options may be considered for each of the targets: aggressive, efficient or sustainable. The “aggressive” option presumes that the best sectors of a development target shall be involved; the coverage of reserves shall be around 60%. The “efficient” option presumes that up to 80% of reserves shall be involved, without drilling in marginal zones. The “sustainable” option presumes that full-scale drilling shall be involved and 100% of a target’s reserves shall be brought into development.
All of the options presume that a formation pressure maintenance system is in place. Flooding for dispersed and line-drive waterflood systems is determined by the number of production and injection wells. The injected amount of water is calculated through a water injection ratio. A selected development option determines the field development rate (from years one to seven), as well as the well density grid and the recovery rate.
Each of the targets is drilled using an individual well spacing pattern with a selected well completion type: deviated (DW) or horizontal wells (HW). Hydralic or multi-stage hydraulic fracturing can applied to each of the completion types.
Judging by past experience, well planning for horizontal wells, the length of the horizontal section is accepted as 750m for small fields with in-place reserves of up to 5 MT; for the rest of the fields 1000m is used. The number of stages in a hydraulic fracturing job is determined through distance between each operation equal to 150m.
To evaluate the possible variations, a series of calculations were carried out using the three options (sustainable, efficient, aggressive). The variants with different types of well completion (DW and HW) were calculated on each of the options. The target will be brought into development in 2022. According to the method described above, the system has determined the dynamics of oil production and the well stock dynamics for the producing and injection wells, broken down by year.
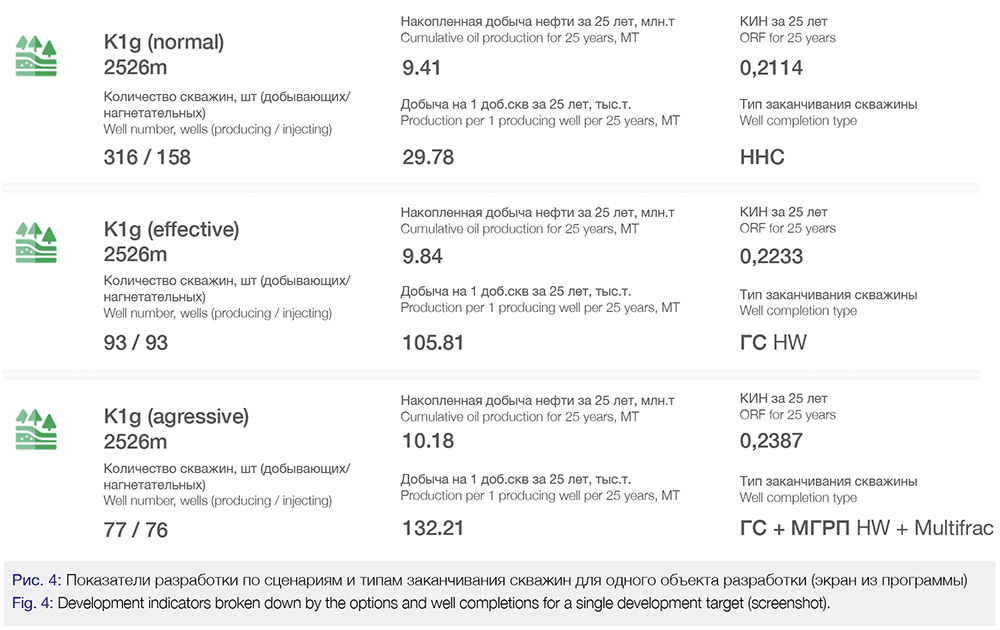
The results of each option has been consolidated into a graphical representation demonstrating the key development indicators: well stock (producing/injecting), cumulative production for 25 years, specific production per well, well completion type, as well as the ORF for 25 years of development (Fig.4).
The results of the engineering simulations based on all of the options are presented in Table 2. The option for drilling deviated wells would require the maximum construction of 474 wells with the sustainable option, 289 wells with the aggressive option; for 25 years, the specific oil production would amount to 29.8 thousand tons and 36.7 thousand tons, according to the options, respectively. When we move to the next options and well completion types, the number of wells goes down and the specific oil production per well grows.
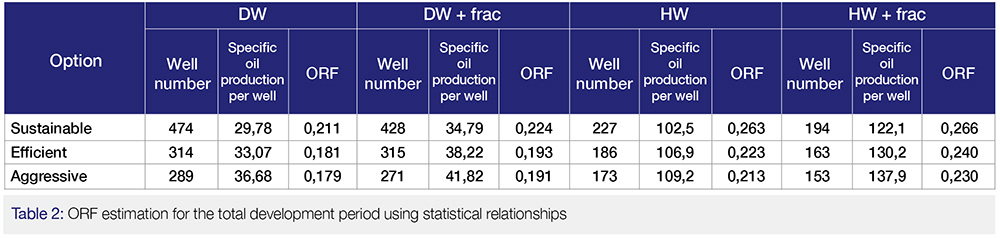
The maximum ORF (for 25 years) – 0.266 unit fractions – was obtained for the sustainable option of drilling the target using horizontal wells with multi-stage hydraulic fracturing, with a total well stock of 194 wells; the specific oil production amounted to 122 thousand tons for 25 years; for the aggressive option, the total well stock of horizontal well using multi-stage hydraulic fracturing amounted to 122 thousand tons, while the specific cumulative production was maximum 138 thousand tons. Thus, the ORF data scattering, using the options and well completion types, spreads from the minimum of 0.179 to the maximum of 0.266. The maximum ORF was obtained in the sustainable option with horizontal wells using multi-stage hydraulic fracturing, while the maximum specific oil production per well was obtained using the aggressive option with horizontal wells and multi-stage hydraulic fracturing (Fig. 5-7).

That said, one should note that it is still too early to compare the economic efficiency of different options at this stage. As a rule, options with higher production demand higher expenditures for drilling. The calculation of economic efficiency is carried out in the automated software system Ingenix Cost Evaluator on the basis of next stage engineering calculations (this was described in more detail in the article “Greenfield Valuation: How to Reduce Initial Investor Risks?”, ROGTEC, Issue 63).
Thus, the module calculating the oil field development indicators lets an investor, early in the stage of target selection and investment decision preparation, not only to obtain the estimation of the oil production profile on an evaluated asset, but to also determine an optimal approach to its development.
The module is not meant to create an engineering design of a field at the project definition phase and for any operational control of the development, therefore, it cannot provide a user with such features like, depletion estimation, or the estimations of options with the use of equipment for dual production and injection.
However, at the advanced planning stage, it can provide a potential investor with an advantage while searching and sorting the input data, the advantage of methodical uniformity and the computation speed due to:
• unified database by region and development targets;
• high calculation speed;
• multivariations (3 development options);
• “multitargetness” (dealing with up to three development targets at a time);
• possibility of setting up various well completion types;
• flexibility (possibility of inputting your own initial data).
Thus, the target objective of estimating production profile over a field can be solved without building any complex hydrodynamic models and involving any third-party contractors. It took us 30 minutes of time to carry out a series of calculations (without taking into account further economics). As a result, an investor would gain a chance, within a short time, to evaluate several possible project development options, from geology to economics, and optimize his risks when entering a project.
Authors
Alexander Kirillov, Head of Development Department, «Ingenix Group» LLC,
Dmitry Semiglasov, Lead Expert of Development Department, «Ingenix Group» LLC