Is There a Fault in Fracture Modeling?

Currently, hydraulic fracturing is a highly demanded technological operation for the intensification of hydrocarbon production from different types of reservoirs and increasing the injectivity of injection wells. The purpose of hydraulic fracturing is to create a network of fractures in the rock. Planning, support, and optimizing hydraulic fracturing operations is carried out using packages of specialized software developed by individual companies – so-called hydraulic fracturing simulators. The software can be sold to the customers for their own use or as part of services. Hydraulic fracturing planning includes performing calculations to assess the necessary data for fracturing of rocks in a particular well. The data may include: bottomhole fracturing pressure, density and viscosity of the fluid with proppant, the volume of the displacement fluid, the length and openness of fractures, etc. The relevant solutions and dependencies for the calculations are obtained on the basis of theoretic ideas about the processes that occur when the pressure in the well is increased using the frac fluid. All calculations assume that fractures develop symmetrically in the axis of the well. The type of fractures that are considered for oil and gas industry are mainly vertical.
Theory of Rock Hydraulic Fracturing
The theory of hydraulic fracturing is an analysis of the processes that occur during the formation and propagation of fractures from the well into the formation, using certain fluids to break and expand fractures deep into the rock. Most of the theoretical studies explaining the mechanism of hydraulic fracturing are based on the fracturing criteria in continuum dynamics for dense, homogeneous, isotropic samples that are assumed to be elastic all the way through to fracturing.
The main theoretical solutions were published in the 1950s-1960s by the authors, after whom analytical models of hydraulic fracturing were later named. The priority solution was presented in paper [2]. The originality of this paper lies in the analysis of the distribution of the effective pressure around the well during fluid injection into supposedly permeable, elastic rock. At the moment of the fracture formation, filtration of injected fluid generates volumetric forces that create pressure. This pressure relieves vertical and horizontal stresses acting on the rock matrix, thus reducing effective pressure. Later on, J. Geertsma supplemented the analytics of this work by proposing to consider the compressibility of rocks. The solution of these authors is the KGD model (Kristianovich-Zheltov, Geertsma-de Klegk).
Another model is PKN (Perkins, Kern, Nordgren). The difference between the models is that in the first model deformation is plain in horizontal section, and in the second model deformation is plain in vertical section.
There is also a radial model – an axisymmetric model of fracture propagation. In this model the flow is described by a one-dimensional equation, in which the distance from the well to the fracture is a spatial coordinate.
The listed models are two-dimensional analytical models (2D). It is assumed that these models do not take into account the real geological structure of the reservoir and with the emergence of so-called pseudo-three-dimensional models the use of two-dimensional models started to be restricted. In fact, pseudo-three-dimensional models are an extended versions of the 2D models.
The Pseudo3D is an advanced PKN model. The primary difference from the 2D model is that it takes into account the vertical distribution of minimum horizontal stresses. A number of subtypes of the Pseudo3D model are used for numerical implementation.
The flat three-dimensional model Planar3D is characterized by a small number of simplifying assumptions, which resulted in a wide application. As compared to the previous model, it requires significantly longer calculation time.
For rocks with a lot of natural fractures, it is assumed that the frac fluid flows through a branched system of existing fractures (in this case, the shape of the fractures is not flat, as opposed to other models). The corresponding model – the best known UFM (Unconventional Fracture Model) – is used in fracturing simulation in unconventional reservoirs. Allegedly, this model allows to estimate the volume of rock stimulated by fracturing.
It should be noted that in the theory of hydraulic fracturing the process of development of horizontal fracture is also considered. Moreover, the development of such fractures is given as much attention as the formation of vertical fractures.
Laboratory Testing
Laboratory testing operations were designed to refine theoretical concepts with. Paper [12] presents the results of more than 100 experiments of hydraulic fracturing simulation. The experiments were conducted mainly on samples of homogeneous and isotropic Fontainebleau sandstones and layered clayey Vosges sandstones.
The permeability of Fontainebleau sandstones, determined at the beginning of each experiment, varies from several mD to several hundred mD with porosity changes from 4% to 11%. Compressive strength: from 200-300 bar to 2000-3000 bar; tensile strength: 10-50 bar. Modulus of elasticity between 300000-400000 bar; Poisson’s coefficient 0.15-0.25 [pressure unit «bar» used in original publication].
The permeability of clayey sandstones of Vosges: from 500 mD to 1-2 D at porosity 15-18 %. Modulus of elasticity 100000-200000 bar; ultimate tensile strength along the stratification plane is very small and reaches 30-50 bar in perpendicular direction.
The samples for the experiments were cylinders with a diameter and height of 10 cm. Inside of each cylinder an 8mm diameter hole («well») was drilled along the axis. Injectors (micro packers) were installed into the hole. Then the sample was saturated in oil under vacuum for 1 day. Individual samples were covered with a layer of epoxy glue from below and above to ensure impermeability of the upper and lower sections of the rock. The prepared samples were placed in a three-axis fracturing chamber. The vertical load on the sample was created by a hydraulic press, a separate pump allowed to apply a side load, a manually operated pump was used to create formation pressure. Pumping units with adjustable flow rate can create a pressure of frac fluid up to 1000 bar. The fracturing process is recorded and controlled by special measuring tools.
Injectors used in hydraulic fracturing experiments allow either circular-radial or spherical flow of the injected fluid. In the first case, the flow is carried out either through the tube with holes drilled along its length (the tube is inserted into the «well») or through two metal end caps, not connected to each other and tightly fixed at the edges of the sample. The first end cap simulates hydraulic fracturing of the well through a perforated casing string, the second end cap simulates hydraulic fracturing in an open hole.
Spherical flow in the center of the sample was achieved with a tube in which 4 mutually perpendicular (in pairs) holes were drilled in the plane of the circle cross-section, or by means of two tubes not connected with each other. The first flow option caused the development of vertical fracture, while the second option – horizontal fracture.
The tests simulated a variety of combinations of vertical and horizontal loads on the test sample, as well as different options of frac fluid flow. The data from the laboratory experiments were compared with the data from hydraulic fracturing in wells.
The main results and conclusions obtained from laboratory experiments are as follows:
1. When fracturing in a perforated string or in an open hole, the fracture direction is determined by the ratio of vertical stress (σv) to horizontal stress (σh). At σv/ σh > 1.5 – vertical fracturing; at σv/ σh < 1.4 – horizontal fracturing.
2. In laboratory experiments it is necessary to distinguish between the pressure of fracture development (usually difficult to detect) and the pressure of complete
fracturing of the rock cylinder, which corresponds to the maximum pumping pressure. In real conditions, the fracture initiation pressure coincides with the total pressure of the rock fracturing.
3. Very few perforation holes lead to significant pressure losses, and a very large number of perforation holes lead to decrease of the pressure of the injected fluid,
which leads to a reduction in the length of the fracture. In practice, it is important to establish the «golden mean» between the perforation density and the distance between perforation intervals.
4. The fracture develops mainly in the most permeable area of the rock. The pressure of the fracture decreases with increasing mobility of the fracture fluid, and, on the contrary, low-filtration fluid is preferable for the growth of the fracture length.
5. Uncertainly located natural fracture does not affect either the development of the fracture (direction and pressure) or its subsequent growth.
6. During fracturing a single fracture develops both in a homogeneous reservoir and in different permeability zones. Initiation of two fractures symmetrical about the axis of the «well» was observed in the samples, but further increase in pressure led to the growth of only one of the fractures.
7. Vertical fracture develops mainly from one side of the well, which corresponds to the asymmetric geometry of Zheltov-Khristianovich’s theory of fracturing.
8. After a horizontal fracture is developed, the direction of the fracture starts to be vertical at a distance of no more than 4 radii of the well from its wall.
The authors of the paper [12] believe that the experimental results are in good alingment with the theory of fracturing. However, the authors warn against automatic transfer of data obtained in the laboratory into field practice. In laboratory experiments, the various factors affecting the fracture are known or can be estimated; for a particular fracturing operation, the loads acting on the rock can only be estimated from the operation itself.
In addition, the conclusions are based on the hypothesis that the fracturing fluid flows in a constant mode, while for the rock the fluid filtration rate (transient mode) should be taken into account. It should also be noted that the various boundary conditions simulated in the laboratory never fully simulate those that exist in reservoirs. Experimental study of the hydraulic fracturing mechanism can provide general guidance that allows to approach the natural conditions to some extent. However, for each particular case, no model can correctly simulate the real conditions existing in the rock and reservoir.
Field Experiments
In recent years, several experiments have been carried out in wells, allowing to advance the understanding and interpretation of the results of hydraulic fracturing. Of particular interest are data from experimental operations performed at special testing facilities and in separate wells.
The National Energy Technology Laboratory (NETL), an agency of the U.S. Department of Energy (US DoE), has established a group of field laboratories to maintain energy security and competitiveness in the independent oil and gas industry in the United States. Below are the most important experimental results obtained through the NETL program.
One of the first field labs is Marcellus Shale Energy and Environmental Laboratory (MSEEL) located in West Virginia [13]. It is funded by the Department of Energy’s (Office of Fossil Energy) and coordinated by a consortium of the University of West Virginia and Ohio State University. The universities manage NETL projects and provide engineering supervision. Initially, the research program was focused on the testing area at Northeast Natural Energy (NNE). Operations started in 2014.
The main objective of Marcellus Shale’s unconventional reservoir studies was to identify the optimum spacing between wells for efficient gas production, improve well completion design and placement of perforation clusters. The latter direction of research is extremely important not only for this area, because during multistage fracturing 50-60% of the fracturing stages do not provide hydrocarbon inflow.
At first, a variety of information on previously drilled wells was collected and analyzed. Logging and core sampling were conducted in a special well. For monitoring of hydraulic fracturing, the well was equipped with a set of seismic receivers. Then two production wells 3H and 5H were drilled.
When drilling the well 3H, 111 feet (~ 34 m) of 4-inch diameter core was taken from the Marcellus reservoir and more than 50 1.5-inch diameter rock samples were taken using a sidewall coring tool. These 50 samples were used for geochemical, microbiological and geomechanical studies. A number of logging studies has been carried out in the vertical and horizontal sections of the well including gamma logging, borehole image with bedding sinusoids, fracture density, minimum horizontal stress, cement bond logging. The horizontal part of the borehole was equipped with a fiber optic cable outside the casing for microseismic monitoring and temperature measurements along the entire length. In total, 26 planned stages of hydraulic fracturing were performed.
It is stated (without details) that these studies allowed to improve well completion design, minimize the impact of rock inhomogeneity on fracture initiation, define the optimum placement of perforation clusters in rocks with similar mechanical properties, identify differences in completion efficiency between different stages of hydraulic fracturing and different placement of perforation clusters. Access to the numerous wells drilled in Marcellus Shale has enabled the rapid identification and implementation of new, cost-effective technologies and scientific advances aimed at increasing production and reducing environmental and social impacts.
The results of operations at the testing area proved the following:
• increased sand concentrations of 100 mesh (0.149 mm) do not degrade reservoir performance as compared to larger sand proppants;
• lower perforation density and smaller hole sizes can be used for each fracturing stage;
• lower perforation density and smaller hole sizes increase the flow rate of the fracturing fluid, which, in turn, increases the fracture pressure and fracturing efficiency;
• the improved completion design has allowed NNE to increase the testing area reserves by 20%, bring old wells into the normal operation mode and use these wells as best practices.
Another testing area is located in Reagan County, Texas. High-quality 3D seismic surveys has been previously performed at this area, a lot of vertical and horizontal production wells have been drilled. This testing area has the logging data and core samples obtained during drilling vertical and horizontal wells. In addition, the results of microseismic and microstrain measurements obtained during hydraulic fracturing were collected for specific wells.
2 old vertical wells were re-commissioned and re-equipped and 11 new wells were drilled. The length of each horizontal well was ~ 10,000 feet (~ 3050 m). Six wells were drilled in Upper Wolfcamp sediments and five wells in Middle Wolfcamp sediments. The wells form a staggering pattern at 660 feet (~ 200 meters) transversely and 450 feet (~ 137 meters) diagonally. The direction of horizontal wells is north-south, presumably perpendicular to the direction of the maximum horizontal stress of the rocks. Then a pilot vertical well was drilled through Wolfcamp formation sediments.

Multistage hydraulic fracturing (over 400 stages in total) was performed in all the horizontal wells. The proppant was sand. Radioactive and chemical tracers were used for hydraulic fracturing. Colored proppant markers were used in two wells. Fracturing with variable injection rate was tested. During fracturing a microseismic monitoring was performed in each well. The operations also included logging, injection tests to analyze fractures and seismic studies between three wells before and after fracturing.
Then, a deviated well (81° angle) was drilled into the fracture zone of two horizontal wells, where colored proppant markers were used for hydraulic fracturing. A 4-inch full-hole core was sampled from Upper Wolfcamp (437 feet – ~133 m) and Middle Wolfcamp (158 feet – ~ 48 m) sediments. Sensors were later installed in the well to monitor pressure changes during production.
The entire core was studied in detail by specialists from two universities and participating companies. There were two main directions of development of natural fractures cemented with calcite: north-east – south-west and west, north-west – east, south-east. 11 faults have been identified, all in Upper Wolfcamp sediments. More than 700 fractures were identified – natural fractures, fractures caused by hydraulic fracturing, fractures caused by changes in stress during core drilling and lifting as well as fractures caused by milling of aluminum sampling barrels. The core was analyzed with a 3D laser and then sawn into individual pieces. The contents of the open fractures were sampled in order to determine the filler, distribution and size of the proppant particles.
Two tests were carried out: one to evaluate the interaction of 11 horizontal wells and one to evaluate the interaction of 13 wells.
According to the data from operations at the testing area in Reagan County, the main results are as follows [4-11,14]:
1. Hydraulic fracturing does not create a network of multiple fractures (as it is usually presented). According to J.Gale, who studied hundreds of core samples, «we
are not dealing with planar bi-winging things» [10]. Spread butterfly wings are implied. There’s only a single fracture on one side of the well.
2. There is no evident hydraulic connection between wells drilled on Upper Wolfcamp and Middle Wolfcamp sediments.
3. The observed hydraulic connection between horizontal wells in the same sediments indicates that the distance between wells is too short for previously approved completion design, especially for Middle Wolfcamp sediments. Choosing the right well spacing and completion design will reduce the number of wells required.
4. The height of fractures filled with proppant that will most likely be the channel for hydrocarbons did not exceed 30 feet (~9 m). At the same time, the fracture
heights calculated using microseismic data are significantly overestimated: these heights range from 550 feet (~168 m) to 1,100 feet (~335 m); the average fracture height for 11 wells is 830 feet (~253 m).
5. At the same time, microseismic data show no growth of fractures down from the lower wall of the horizontal bore, i.e. fracturing does not create hydraulic connection between oil-bearing and water-bearing parts of the reservoir.
6. The highest density of fractures is observed in the core sections closest to the wells with hydraulic fracturing.
7. The observed proppant distribution in the fractures is sporadic: some fractures with high density of proppant, some fractures without proppant. The vast majority of the fractures identified by researchers as fractures caused by hydraulic fracturing are characterized by very low openness. Only three fractures filled with proppant with 5-10 mm openness were found, and all of these fractures belong to Upper Wolfcamp deposits. At the same time, it was found that there is much more proppant in the Middle Wolfcamp core than in the Upper Wolfcamp core. Although the fracture zone in the Middle Wolfcamp was farther from the deviated well than the Upper Wolfcamp fracture zone.
8. The sand grains sampled from the fractures were very fine. Most of them were 1/2 to 1/3 of the grain size passing through a 100-mesh screen. Three slugs of proppant with high volumes of larger grains were an exception.
9. Sporadic distribution of proppant correlates with rapidly decreasing rate of hydrocarbon production.
10.One well with variable fracturing fluid injection rate provided an average 20% increase in production as compared to the nearest 4 wells where the fracturing was performed at constant pump pressure. The increase was observed not only immediately after the fracturing but also in total production after 24 months.
11.The industry trend to increase the length of horizontal wells, the volume of injected proppant and perforation density leads to a significant increase in short-term production, but not to the optimal well design in terms of NPV – net present value.
12. The head of the $25 million federal grant for operations at the testing area in Texas stated that «The «incredible complexity» observed was «far beyond what current simulations can model and predict» [10].
Fracturing Pressure Calculation
Fracturing pressure can be calculated with a different method from the one used in stimulators. This method is based on the following. Drilling of a well results in the disturbance of the initial stress state formed in the rocks before drilling. For an empty cylindrical well, the new stress state is described in the long-known equations:
σz = σver – 2ν (σ1 – σ2) rw2/r2 cos2φ (1),
σr = 0,5(σ1 + σ2) (1- rw2/r2) + 0,5(σ1 – σ2) (1-4 rw2/r2 + 3 rw4/r4) cos2φ (2),
σθ = 0,5(σ1 + σ2) (1+ rw2/r2) – 0,5(σ1 – σ2) (1 + 3 rw4/r4) cos2φ (3),
where:
σver , σ1 , σ2 – Initial vertical, minimum and maximum horizontal stresses, respectively;
σz , σr , σθ – new vertical, radial, tangential stresses, respectively;
ν – Poisson’s coefficient;
rw – radius of the well;
r – current radius;
φ – vectorial angle.
For further calculation the tangential stress on the well walls is of the greatest practical use. Provided r = rw:
σθ = σ1 + σ2 – 2(σ1 – σ2) cos2φ (4).
If the horizontal stresses are equal (σ1 = σ2) and the vectoral angle in the horizontal plane changes from 0° to 90°, the tangential stress is σθ = 2σ1 =2σ2. Thus, in an empty vertical borehole, tangential stress compresses rocks on the borehole contour with a force equal to twice the value of initial horizontal stress (stress concentration coefficient Kcon = 2). For the horizontal well, the initial vertical stress is used instead of the initial horizontal stress.
Filling the well with flushing fluid is equivalent to partial recovery of the initial stress state of rocks and reducing the compressive effect of tangential stress. Mathematically, this is recorded by the equation:
σθ = [σ1+σ2 – 2(σ1-σ2) cos2φ] – Рbot (5),
where Рbot – the solution pressure in the well at the calculation depth.
During hydraulic fracturing the pressure in the well increases up to the moment of fracture initiation. In terms of the previous reasoning, the fracture development occurs in two stages: neutralization of σθ and then exceeding the tensile strength limit of the rock (fracturing). When the bottomhole pressure Рbot is equal to the value of the term in square brackets of the equation (5) and equal to 2σ1 =2σ2, the impact of tangential stress will be neutralized. In other words, at this moment the stress state of the rocks that existed before the well drilling will be restored. Further increase of the injection pressure of the frac fluid will be used to exceed the tensile strength limit of the rock. The sign will switch, and tangential stress will change from compressive stress to tensile stress. Since the tensile strength limits of the rock fracturing are significantly lower than compressive strength limits, the further increase in bottomhole pressure up to a fracturing fracture (Pfrac) is insignificant as compared to bottomhole pressure neutralizing the compressive effect of the tangential stress.
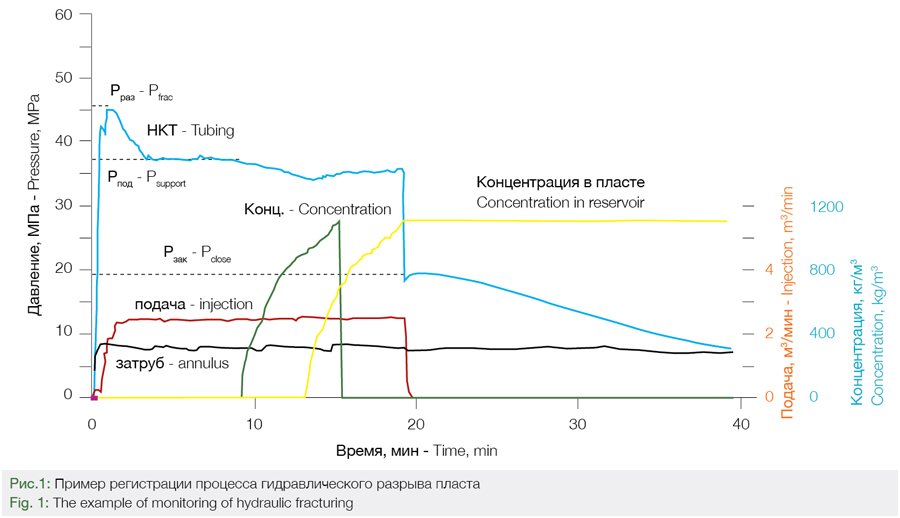
Once the rock is fractured, the bottomhole pressure will decrease. This is because after the fracture is developed, further support for its opening requires less effort than for the fracture itself. That is, the pressure to support the fracture in the open state and to push it deep into the rock Psup > Kcon • σ1. When the pumps stop and the injection of the frac fluid stops, the rock will tend to restore to the original state (before fracturing) and close the fracture. Fracture closure pressure Pclose ≈ Kcon • σ1. This equation provides estimation of σ1. Fig.1 illustrates the calculation of Pfrac, Psup, Pclose.
Verification of the above described approach was carried out based on the data of rock fracturing in two reservoirs (A and B). In both reservoirs, the oil-bearing layer was composed of sandstones. Depth of reservoir A: -(2775÷2885) m. Depth of reservoir B: -(2870÷2920) m. The graph of pressure change during hydraulic fracturing provided the values of
Pfrac, Psup, Pclose. As the values were recorded at the wellhead in all wells, the pressure of the fluid column in the well from the wellhead to the hydraulic fracturing interval was considered additionally. After evaluation of the minimum horizontal stress, the difference between Pfrac and 2σ1 was taken as the tensile strength limit σtensile.
Then simple averages were calculated:
– reservoir A (114 fracturing stages) – Pfracture = 47.3 MPa; σtensile = 8.4 MPa; σ1 = 22.24 MPa;
– reservoir B (34 fracturing stages) – Pfracture = 49,92 MPa; σtensile = 7,0 MPa; σ1 = 23,26 MPa.
Following the above logic (Pfracture = 2σ1 + σtensile ) the calculated average fracture pressure for reservoir A is 52.88 MPa and for reservoir B – 53.52 MPa. Comparison of the calculations with the actual data showed that for sandstones of reservoir A most often the fracture pressure is within the range 51-54 MPa, for sandstones of reservoir B – within the range 52-55 MPa. The proposed approach can be applied without the use of fracturing simulators.
Fracture Density
The main purpose of hydraulic fracturing, as mentioned earlier, is to create a system of fractures in the rock. What is needed to know about fractures in this case? Direction, openness, length and height. Fracturing simulators are used to calculate fracture openness and length. There is no verification of these calculations so far. In some cases, passive seismic monitoring provides an idea of the fracture direction [1]. In the beginning of hydraulic fracturing, seismic waves are observed on both sides of the well, but with further injection of the fracturing fluid – seismic waves are observed only in one direction. In our opinion, this result indicates the initialization of fractures symmetrically about the axis of the well, but only one fracture develops further (similarly to laboratory experiments). Passive seismic monitoring technology increases the cost of hydraulic fracturing. This technology is not widely spread.
The paper [3] «…provides an overview and systematization of the main widely used hydraulic fracturing simulation methods, features, areas of application and key assumptions». Notably, the authors attribute the further development of hydraulic fracturing simulators to the complication of the hydrodynamic model for multicomponent fluid and taking into account porous and elastic effects. Not a single word about fracturing design.
Summary and Main Conclusions
So, what do we actually know about fracturing? We know only what’s shown in Figure 1 and similar simulations. To what extent do the results coincide with the simulator calculations? There is no info as companies don’t publish such information. The reasoning about the created fracture and corresponding illustrations reflect purely theoretic ideas of the authors.
Based on the results obtained during laboratory and field experiments and taking into account some theoretical solutions, it is possible to formulate the main conclusions useful for practice:
• when the rock fracturing pressure is reached, two fractures are initiated symmetrically about the axes of the well, but only one fracture develops deep into the rock (in this regard the term «fracture half-length» is nonsense);
• the fracture plane is parallel to the axis of the vertical wellbore and perpendicular to the axis of the horizontal wellbore;
• regardless of the direction of the wellbore, the fracture propagates along the path of least resistance – perpendicular to the direction of the minimum horizontal
stress;
• proppant distribution in the fracture is sporadic, which correlates with the rapidly decreasing hydrocarbon production rate;
• natural fractures in the rock do not affect either the development of the fracture or its growth deep in the rock;
• in multistage fracturing, at least 50% of the hydrocarbon fracture stages will not produce hydrocarbons;
• the results of microseismic studies significantly overestimate the height of the fracture;
• high fracturing efficiency is possible with reduced perforation density, reduced perforation holes size, application of variable fracturing fluid injection rate;
• none of the applied hydraulic fracturing simulators reflect the real design of fracture fractures, i.e. the simulators do not solve the main task of hydraulic fracturing.
Literature
1. Alexandrov S.I., G.N. Gogonenkov, A.G. Pasynkov Passive Seismic Monitoring for Control of Geometric Parameters of Hydraulic Fracturing. Neftyanoye Khozyaystvo, 2007, №3, p.51-53.
2. Zheltov Yu.P., Khristianovich S.A. About hydraulic fracturing of oi reservoir. Izv. of the USSR Academy of Sciences, OTN, 1955, No. 5, pp. 3-41.
3. Khasanov, M.M.; Paderin, G.V.; Shel, E.V.; Yakovlev, A.A.; and Pustovskikh, A.A. Approaches to Hydraulic Fracturing Simulation and Areas for Development. Gazpromneft STC LLC, 25 January 2018.
4. Ciezobka J. Hydraulic Fracturing Test Site. DE-FE0024292.Presentation, August 15, 2018.
5. Ciezobka J., Courtie J., Wicker J. Hydraulic Fracturing Test Site – Project overview and summary of results. URTEC – 2937168, 2018.
6. Elliot S.J., Gale J.F.W. Analysis and distribution of proppant recovered from fracture faces in the HFTS slant core drilled through a stimulated reservoir. URTEC- 2902629, 2018.
7. Gale J.F.W., Elliot S.J., Laubach S.E. Hydraulic fractures in core from stimulated reservoirs: core fracture description of HFTS slant core, Midland Basin, West Texas. URTEC-2902624, 2018.
8. Hydraulic Fracturing Test Site (HFTS), Project Number DE-FE0024292.
9. Maity D.,Ciezobka J., Eisenlord S. Assessment of in-situ proppant placement in SRV using through-fracture core sampling at HFTS. URTEC – 2902364,2018.
10. Rassenfoss S. Real fractured rock is so complex it’s time for new fracturing models. Journal Petroleum Technology, 2018,vol.70, Issue:11.
11. Stegent N.,Candle C. Downhole microseismic mapping of more than 400 fracturing stages on a multiwall pad at the HFTS. URTEC – 2902311,2018.
12. Le Tirant P.,Baron G. Fracturation hydraulique des roches sédimentaires en conditions de con-traintes de fond. Comptes rendus 3 Colloque de l’A.R.T.F.P.,Paris,1969,p.361-420.
13. Vagnetti R., Ciferno J. Federal field laboratories improving production efficiency, minimizing environmental impacts. World Oil,May 2019,Vol.240,№5.
Author