Laboratory and Field Tests for an ASP Flooding Project

Y.Е. Volokitin, M.Y. Shuster, V.М. Karpan,
I.N. Koltsov (Salym Petroleum Development N.V.), А.G. Skripkin
Introduction
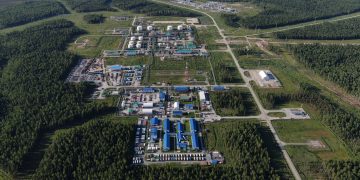
ASP projects involve the use of expensive chemicals, so Salym Petroleum Development (SPD) has taken a holistic approach to gradually de-risk the technology. The evolution of the ASP project at the West Salym field is shown in Figure 1. The first stages relied on extensive laboratory tests to select the right surfactant and perform core experiments to find the best ASP formulation. These were followed by a field tracer test. These three stages completed, SPD has started a field pilot test of the ASP technology.

Selection of Surfactant
The initial stage of the project involved extensive laboratory tests to define the composition of the ASP solution that would work efficiently in the conditions of the West Salym field. This article will only focus on the key processes used in the tests, with more detailed information available in other sources [1-4].
The first stage focused on the selection of the surfactant and polymers that would have chemical and physical stability in the reservoir conditions. West Siberian oil fields are characterized by relatively high temperatures and low water salinity, which emphasizes the need for long laboratory tests of temperature stability of the surfactant and polymer. In such experiments, test tubes with a water solution of the chemical (surfactant, polymer and others) were put in a heater for a period of from several weeks to several months, after which the chemicals were tested for the stability of their physical and chemical properties. In certain cases, the manufacturer provides information on the stability of the chemicals they produce, which considerably accelerates the initial selection process.
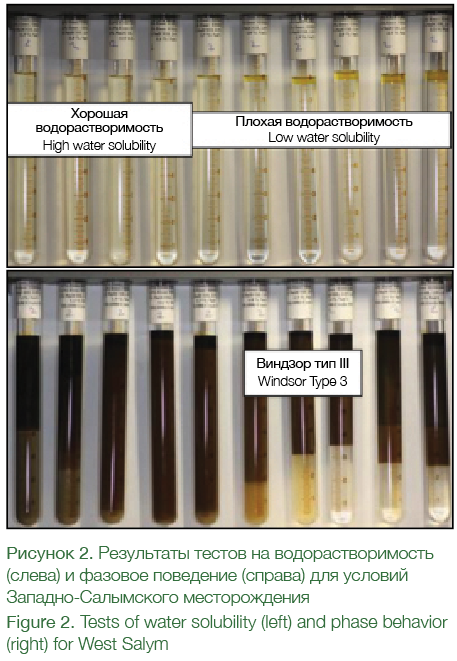 The first stage of the tests was followed by solubility tests of various ASP components (especially the surfactant) and phase behavior experiments to determine whether the ASP solution would be capable of forming micro emulsions with oil. In the first type of tests, the chemicals were mixed with a salt solution and held at the reservoir temperature. In the phase behavior tests, degassed crude from the field was added to the test tube. The typical results of these tests are shown in Figure 2. Internal olefin sulfonates (IOS) with high molecular weight were the best surfactant performers in the phase behavior tests [5-7]. However, they have a major disadvantage of low water solubility, which is shown in left-hand picture in Figure 2, where a layer of undissolved surfactant is clearly visible. Solvent isobutanol was added to the surfactant solution to improve solubility.
The addition of isobutanol considerably improved the stability of the ASP solution at the reservoir temperature. However, phase separation can take place earlier, in the surface equipment used to prepare the ASP mix, which operates at lower temperatures. Therefore, an additional test was taken to check the water solubility of the ASP components at temperatures below the reservoir temperature [8].
Core Experiments
Flow experiments on the cores taken from the field formed the next and extremely important stage in the whole process. This stage required a lot of specialized chemicals and highly qualified personnel, which made the process more complicated as compared with the traditional core flooding experiments. SPD together with the Tomsk-based research company TomskNIPI-Neft performed several dozen core experiments to optimize the ASP formulation. The main parameters and results of such experiments are shown in Table 1 and Figure 3.
The experiment involved the following flooding sequence to achieve maximum recovery:
» Traditional waterflood with the injection of model formation water. This stage continued until a maximum amount of mobile oil could be displaced from the core. In this experiment, residual oil saturation post the
waterflood was 33%;
» Injection of ASP in the amount of 40% of pore volume of the column. When injected into the core, the ASP
solution mobilizes trapped oil, which forms an oil bank. At exit from the column, oil in the oil bank accounts for 30-40% of the effluent volume (See Fig. 3а);
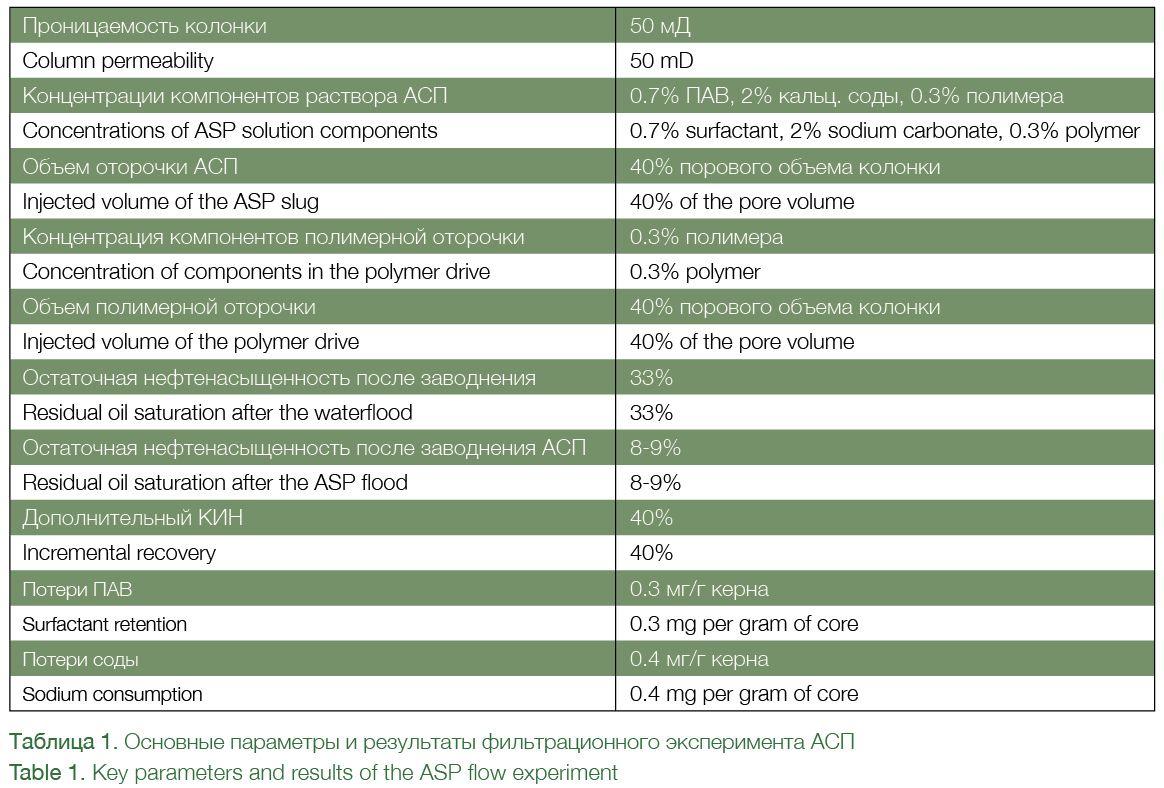
» Polymer flooding in the amount of 40% of the pore volume of the core column to displace mobilized oil and ASP slug from the core. At the start of the polymer drive, pure oil was produced from the oil bank. At the end of this stage, oil was produced mostly in the form of an emulsion;
» After flooding – the injection of model formation water to maintain pressure, after the injected chemicals and water-oil emulsions were displaced from the core.
In this experiment, the ASP flood recovered more than 75% of the oil left behind after the waterflood, and the incremental recovery was 40% from the initial oil saturation. Notably, the consumption of surfactant and sodium carbonate in the core taken from the field was much higher than the consumption of these chemicals observed in previous experiments. The considerable loss of the surfactant and sodium account for a marked increase in residual oil saturation after the ASP flood in samples located closer to the end of the column (See Fig. 3b).

On the results of these lab tests, a decision was taken to try out this ASP formulation in a field single well tracer test.
Field Single Well Tracer Test
The objective of the field tracer test was to measure injectivity and the efficiency of the ASP flood in field conditions, and acquire practical experience of using the ASP technology. The efficiency of the ASP flood is measured by comparing the residual oil saturation before and after the ASP flood over an area covered by such a flood. A well-known and broadly used method of injecting water solutions of tracer chemicals was used to measure the residual oil saturation [9]. Ethyl acetate (EtAc) is used as the tracer, which distributes between the static phase (trapped oil around the ASP-flooded bottomhole of an injection well) and mobile phase (a mixture of connate and injected water). As the EtAc water solution is injected, some of the tracer chemical stays in oil, which lowers the velocity at which it travels into the formation. After a strictly controlled volume of such tracer bank is injected, the well is shut in for several days. During this time, the tracer continues to be distributed between the phases, and that part which remains in water hydrolyzes to form ethanol (EtOH). For all practical purposes, ethanol is not soluble in oil and stays in water. After that, a pump is run in the well to recover the previously injected liquid. EtAc and EtOH concentrations are then measured in the recovered fluid, and the data is used to calculate average residual oil saturation in the area covered by the test. Since ethanol does not dissolve in oil, it is recovered earlier than the ethyl acetate, which stays mainly in oil. In an ideal case, the change in concentrations as the function of the volume of produced liquid would form 2 curves, which follow one another as shown in Figure 4.
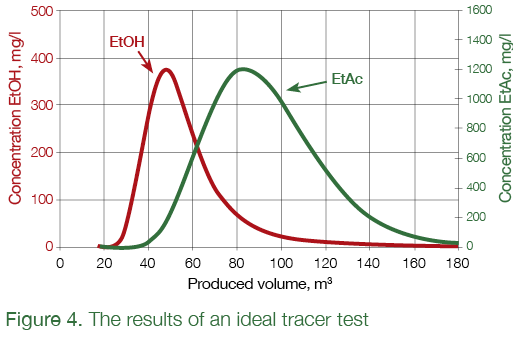
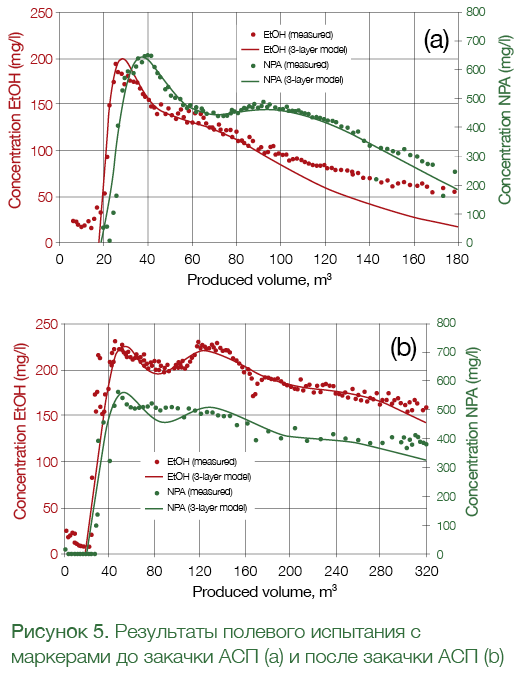
The distance between the peaks in the concentration profiles for ethanol and ethyl acetate is used to determine the residual oil saturation: the bigger the distance, the higher the residual oil saturation. In real life, though, the curves shown in Fig. 4 will be affected by many factors, including cross-flows between formations, the dispersion of liquid during shut-in, continuous hydrolysis of ethyl acetate, the movement of injected slug under the influence of neighboring injection wells, and others, which makes interpretation much more challenging and contributes to interpretation error. To better trace the ethyl acetate, propanol (NPA) was also added to the injected liquid, which was used as the ethyl acetate tracer for further data interpretation (See Fig. 5).
Figure 5 shows the results of the field tracer test in a West Salym field well. Tracers were used to measure residual oil saturation before (Figure 5а) and after the injection of ASP (Figure 5b). The measured tracer concentrations were interpreted using both analytical and hydrodynamic models. The horizontal distance between the peaks of concentration profiles of EtOH and NPA (i.e. EtAc), which was clearly visible before the injection of ASP, almost totally disappeared after the ASP flood. Detailed analysis of the data showed that the residual oil saturation went down from 23% before the ASP flood to 2% after the flood in the area covered by the test. Considerable reduction of residual oil saturation showed the efficiency of the selected ASP formulation in field conditions.
The results of the test formed the basis for a decision to use the formulation in a pattern pilot test of the ASP technology.
Therefore, the process of selecting ASP components consists of 4 stages: 1) screening, thermal and chemical stability, 2) selection of active surfactant to achieve low interfacial tension, 3) optimization of the ASP formulation through flow experiments on core, and 4) test of the ASP solution effectiveness in field conditions. It took SPD 4 years to successfully complete all these stages.
Literature
[1] Flaaten A.K., “An Integrated Approach to Chemical EOR Opportunity Valuation: Technical, Economic, and Risk Considerations for Project Development Scenarios and Final Decision”, PhD thesis (2012) [2] Liu S., “Alkaline Surfactant Polymer Enhanced Oil Recovery Process”, PhD thesis (2007) [3] Skripkin, A.G., Kuznetsov, I.A., Volokitin, Y.E., Chmuzh, I.V., “Experimental studies of oil recovery after Alkali-Surfactant-Polymer (ASP) flooding with West Salym cores”, SPE-162063 (2012) [4] Volokitin, Y., Sakhibgareev R., “Chemical and Analytical Work in Support of West Salym Field Enhanced Oil Recovery Project (ASP)”, SPE-162067 (2012) [5] Barnes, J. R., Dirkzwager, H., Smit, J.R., Smit, J.P., On, A., Navarrete, R. C., Ellison, B.H., Buijse, M. A. “Application of Internal Olefin Sulfonates and Other Surfactants to EOR. Part 1: Structure – Performance Relationships for Selection at Different Reservoir Conditions”, SPE-129766 (2010) [6] Buijse, M. A., Prelicz, R. M., Barnes, J. R., & Cosmo, C. “Application of Internal Olefin Sulfonates and Other Surfactants to EOR. Part 2: The Design and Execution of an ASP Field Test. Society of Petroleum Engineers” SPE-129769 (2010) [7] Dijk, H., Buijse, M.A., Nieuwerf, D. J., Weatherill, A., Bouts, M., Kassim, A., Stoica, F., Cosmo, C., “Salym Chemical EOR Project, Integration Leads the Way to Success”, SPE-136328-RU (2010) [8] Karpan, V.M., Volokitin, Y.E., Shuster, M.Y., Tigchelaar, W., Chmuzh, I.V., Koltsov, I.N., Tkachev, I.V., van Batenburg, D.W., Faber, M.J., Skripkin, A., “West Salym ASP pilot: Project Front-End Engineering”, SPE-169157 (2014) [9] Tomich, J. F., Dalton, R. L., Deans, H. A., Shallenberger, L. K. “Single-Well Tracer Method To Measure Residual Oil Saturation” SPE-3792 (1973)