LUKOIL: How Data Mining Enhances Oilfield Development

Long-term field development plans dictate that a variety of well services are carried out in order to increase well productivity. Perforation jobs (perforation of previously unperforated intervals and reperforation) are one of these methods. Perforation is relatively low cost, and its effect can be predicted based on a small amount of initial data. In some cases, the outcome of an operation is not what is expected, and on this basis, it is necessary to try to predict the results as accurately as possible. The BV8 formation in the Povkhovskoye field was selected as a research target for this paper. The target was selected due to the volume (1376) of reperforated jobs. The correspondence between the influencing variables and the efficiency of the activities was explored to build a mathematical model with the use of standard “Data Evaluation” packages of MS Excel and the “Data Mining” methods (regression of the neural network, the linear regression) making it possible to select candidate wells for certain types of jobs. The approach applied in this research work can be employed at other production facilities and fields, as well as in other types of wells.
Introduction
When a field is in long-term development, various well services are carried out to increase well stimulation. Perforation jobs are one of these methods, it is low cost and it’s performance can be predicted with limited data. The purpose of this work has been to search for correlations between the influencing variables and the efficiency of the activities, and to build up mathematical models that make it possible to easily find candidate wells for certain types of jobs, using the BV8 target of the Povkhosvksoye field as an example.
The given target was selected due to the fact that it has a sufficient volume of perf jobs for the analysis. The Povkhovskoye field was discovered in 1972, and brought into development in 1978. The field is located in the Surgut district of the Khanty-Mansi Autonomous Area of Tyumen region, 80 km away from the town of Kogalym. The targets of BV8, Achimov and JV1 are currently under development. The field is multilayered, with a complex subsurface geology and oil-bearing capacity was confirmed in the deposits of the Megion, Bazhenov, Vasyugan and Tyumen Suites. Judging by the size of its’ reserves, it can be referred to as a “major” field. The largest reserves are located on the BV8 productive reservoir which is characterized with the highest degree of permeability. The BV8 target is the core formation that determines the total field production volume and the target area has been developed since 1978. Total recovery amounts to 85.2% of the initial recoverable reserves, with water cut amounting to 89.5%. Processing the data on the previously performed perforation jobs comprised of the following steps: – model building to evaluate the liquid rate value and changes in water cut using the MS Excel “Data Evaluation” package; – model building with the use of the Data Mining methods (regression of the neural network, the linear regression) of MS Azur MLS. The first stage comprised of the collection and processing of the field geologic and engineering data. 5810 perforation jobs were performed. The activities that matched the following specific criteria were used for the analysis:
• the perforation jobs were not primary for a selected well, although they were primary for a selected interlayer (1653);
• the database contained additional perforation jobs performed since the year 2000 (1256);.
• additional perforation jobs were carried out without hydraulic fracturing operations (541);
• well shut-down period prior to additional perforation jobs was not exceeding 1 year (420);
• additional perforation jobs were performed at the producing well stock (213);
• additional perforation jobs were carried out with no additional activities following them (195);
The regression models obtained can be easily be implemented and they demonstrate sufficiently high coefficients of determination. The approach applied in this work can be employed at other production facilities and fields, as well as in other types of well stock activities.
According to the Dupuis formula, the basic data values having impact on the liquid rate level are as follows – formation thickness, permeability, drawdown, external reservoir boundary, viscosity and skin-factor. To build up a mathematical model for evaluation of the liquid rate level, the first three parameters were employed due to high accuracy of their determination. One more parameter, namely the maximum liquid rate from the offset wells, was included into the equation in order to evaluate the actual reservoir productivity. To determine the water cut obtained after performed activities, the following parameters were employed:
• The size of remaining recoverable reserves of oil per 1m of formation thickness – it takes into account the current stratal water saturation;
• The water cut before the performed job – it takes into account the impact the already connected interlayers provide for the value of water cut after the activities have been performed;
• The liquid rate increment after the performed activities – it takes into account the mutual interaction of the water and oil phases.
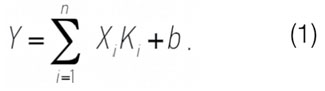
First of all, model building with the use of the linear regression methods has been considered in the given research work, with the help of the imbedded “Data Evaluation” package of MS Excel. The essence of the regression is in determination of the degree of impact of each of asserted influencing variables X1, … , Xn on the dependent variable Y. After that, the regression coefficients Ki are to be searched, for the best presentation of the liquid rate and water cut obtained after performed additional perforation jobs [1-3]
Building a Model to Evaluate the Liquid Rate and Changes in Water Cut Using the MS Excel “Data Evaluation” Package
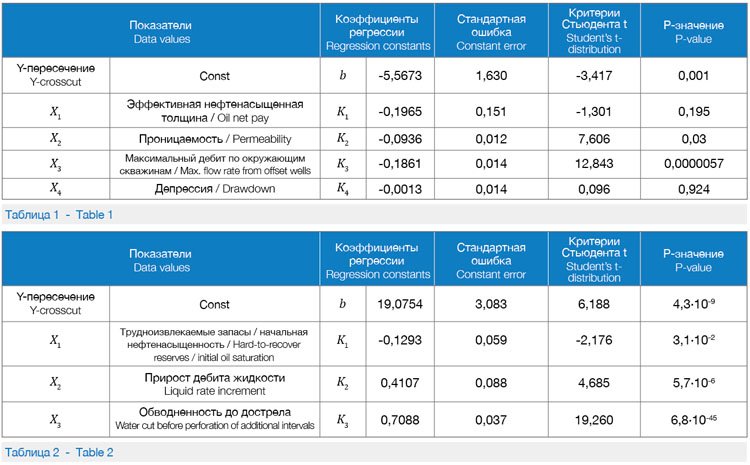
The first stage included model building to determine the liquid rate increment after additional perforation jobs. The regression coefficients, the constant error values, the Student’s t-distribution, and the P-values are presented in Table 1. The formula used to determine the liquid rate increment Yq, obtained after performed activities has the following view in the linear regression model:
Yq = -0,1965X1 + 0,0936X2 + 0,1861X3 + 0,0013X4 – 5,5673. (1)
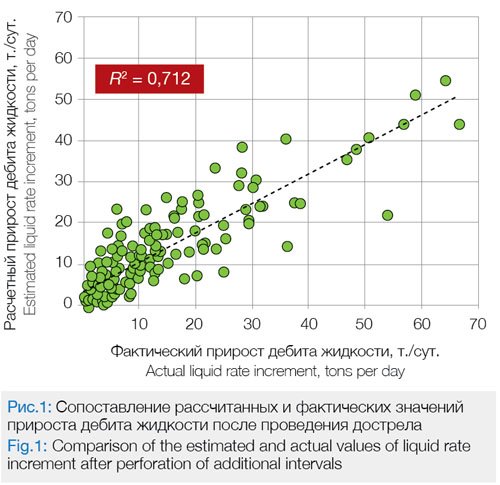
The correlation of the estimated and actual liquid rate value, obtained after additional perforation jobs demonstrates the high precision of the data, the coefficient of determination R2 being 0.1712 (Fig.1).
The P-value on the oil net pay and drawdown amounts to over 0.05, which, according to the rules of descriptive statistics, points to low impact of the factor on the resultant value or just means no effect. The results can be explained in the following way. First, there appears to be some uncertainty while selecting the version for interpretation of geological data. For instance, according to the actual version of the “Reinterpretation_2001”, the reservoir with oil net pay of 1.5m was selected, while the relevant parameter according to the version of the “CSRM-Neft_2011” amounts to 12.1m. In this connection, the results of the stream gauging agree with the second version of the interpretation. Secondly, the formation pressure values are taken off from the isobar map, the maps, in this regard, are prepared with the periodicity of once per quarter, based on a certain set of values obtained directly from wells, while the remaining part of the values can be obtained through calculations.
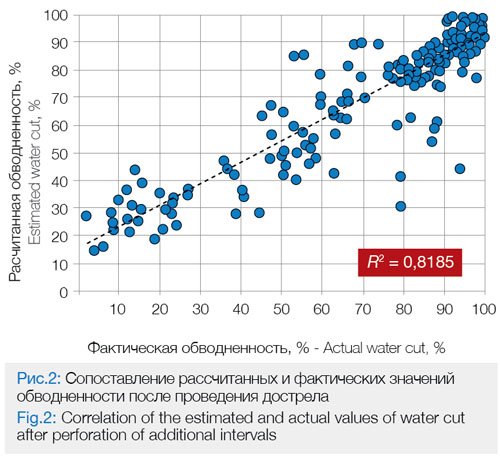
The bottom-hole pressure is generally calculated through dynamic level which in many cases also downgrades the quality of initial data. Hereafter, a model was built to determine the water cut after performed additional perforation jobs. The coefficients of regress, the constant error values, the Student’s t-distribution, and the P-values are presented in Table 2. The formula determining the water cut Yf after the performed activities looks, in the linear regression model, as follows:
Yf = -0,1293X1 + 0,4107X2 + 0,7088X3 + 19,0754. (2)
Correlation of the estimate and actual water cut values, after the additional perforation jobs were performed, demonstrates high precision of data, R2 being 0.8185 (Fig.2).
Data Mining is a catch all term used when using complex of methods to discover previously unknown interpretations that decision making.[4]. Data Mining is used in such disciplines as statistics, the information theory and machine learning. Therefore, the major part of its algorithms was elaborated on the basis of different methods from those disciplines. As a concept, Data Mining comprises: the theory of databases, image identification, descriptive statistics, machine learning, visualization, algorithms and artificial intelligence. In this regard, you can use a variety of software products to implement your Data Mining objectives, such as R-Studio, Microsoft Azure MLS, Orange and many others.
Model Building with the Use of the Microsoft Azure MLS Software
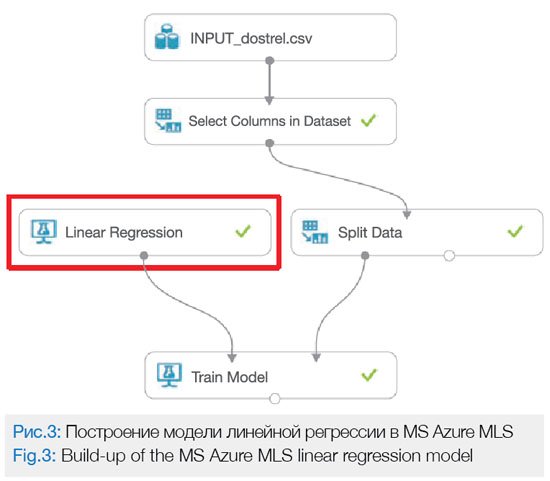
The presented work considers two methods: the linear regression method and the method of regression of the neural network implemented in the Microsoft Azure MLS software (Fig.3). This software is sufficiently easy to use, free to download and install, and has the imbedded modules where various algorithms are embodied. That said, confidentiality and protection of the uploaded data is also preserved. Creating an experiment in Azure Machine Learning Studio comprises the following steps: the transmission of a data set in the format of CSV-file (tabular data in the format of text) to the Machine Learning Studio;
• Creating an experiment and using the Module “Select Columns in Dataset” (selection of columns in the data set) to select the same data features as they are used in MS Excel;
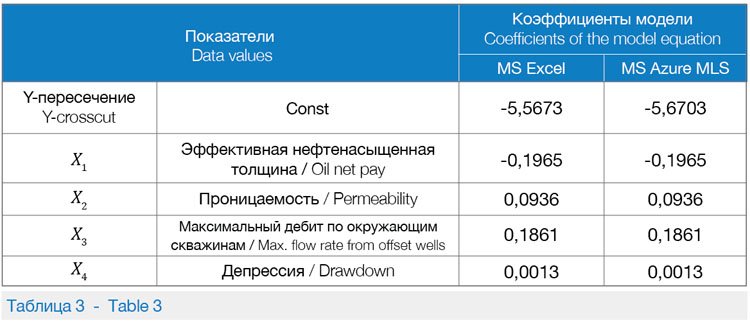
• Using the “Split Data” Module in the mode of relative expression to split data into the same datasets for learning as they are applied in MS Excel. When using the “Linear regression” Module in Azur Machine Learning Studio, there are two methods available to apply: The Gradient Descent method in the online mode (used for large-scale problems), the method of Least Squares (the mostly spread method of the linear regression). This would be an optimal selection for a small data amount. Table 3 displays correlation of the coefficients obtained in the models of MS Excel and MS Azure MLS for estimation of the liquid rate increment. It is obvious that the obtained models have similar data values.
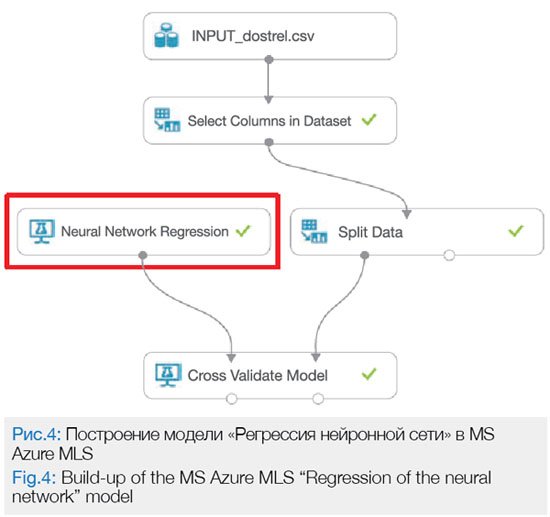
After that, the method of Data Mining was considered in the research work, and namely, the “Regression of the Neural Network” (Fig. 4). The algorithm of the neural network (Microsoft) is useful for the evaluation of large datasets. The algorithm of the neural network in the SQL Server Analysis Services (Microsoft) combines every possible state of the initial data value with every probable state of the predicted data value, applying it to calculate the probabilities.
Further, these probabilities can be applied to predict a considered parameter, based on the input data. The model of data mining, created with the use of the Microsoft neural network algorithm, can contain several networks. Their number is determined with the number of columns used for data input. The algorithm creates a network consisting of two or three layers of neurons. The layers refer to the input data layer, optional hidden data layer, and the output data layer. The model of the neural network must contain a key column, one or several input data columns and the predicted data value columns.
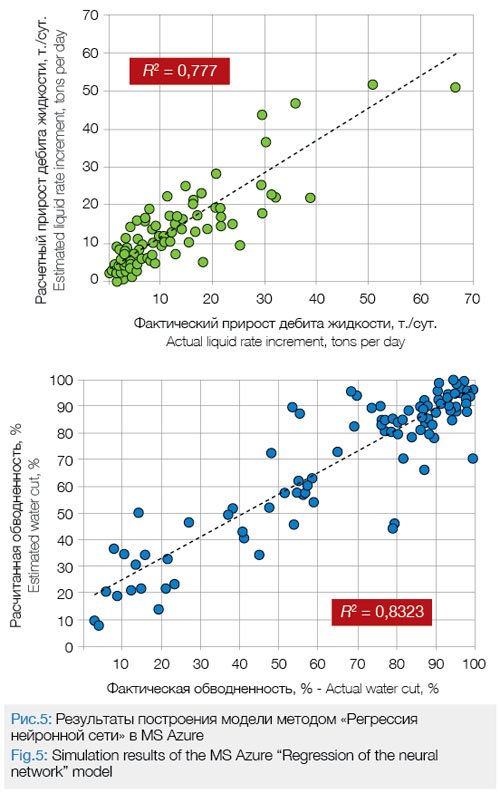
Fig.5 presents the calculation data of the liquid rate increment and changes in water cut, obtained with the use of the models built in MS Azure MLS by the “Regression of the neural network” method. Comparing Figures 1, 2 and 5, we can see that the model built in MS Azure MLS, using the “Regression of the neural network” method, is characterized with somewhat better precision in relation to the actual data values.
Conclusion
The introduction of “Big Data” technologies into the oil and gas field development process, from our perspective, has been a success. The presented research work points at the possibility of using the Data Mining methods to evaluate the initial data based on previously conducted perforation jobs, as well as for predicting the efficiency of scheduled jobs. The regression models obtained as a result of this work can be easily implemented and demonstrate sufficiently high coefficients of determination. The approach applied in this work can be employed at other production facilities and fields, as well as in other well stock activities.
References
1. Kolemaev V.A., Staroverov O.V., Turundaevskiy V.B., Teoriya veroyatnostey i matematicheskaya statistika (Theory of probability and mathematical statistics), Moscow: Vysshaya shkola Publ., 1991, 400 p.
2. Makarova N.V., Trofimets V.Ya., Statistika v Excel (Excel statistics), Moscow: Finansy i statisti-ka Publ., 2002, 368 p.
3. Savel’ev V., Statistika i kotiki (Statistics and kitties), Moscow: AST Publ., 2017, 126 p.
4. http://pandia.ru/text/78/271/8297.php
Article Authored By:
А.A. Ankudinov,
Ph.D. Engineering,
N.S. Polyakova,
Y.E. Radevich
Branch of “LUKOIL Engineering” LC “KogalymNIPINeft” in Tyumen
Published with thanks to Gazprom Neft
& PROneft Magazine