LUKOIL Engineering: New Approaches for the 3D Modelling of the Varandey Field
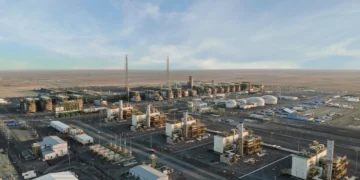
The Varandey Field is an oil field located in the Nenets Autonomous District in the Arkhangelsk Region. This oil field belongs to Timan-Pechora Basin. The first well in the Varandey Field was drilled in 1974 and commercial oil production in this area started in 1985. At that time the first tanker with Varandey commercial oil was sent to Arkhangelsk
Amid high oil demand the main task of any operator company is to use all possible approaches for the maximum possible oil recovery from reservoirs of any type and complexity. There are a multitude of issues related to the studying of reservoirs which occur at different depths includes their structure, geological-and-physical properties and formation fluids joint motion characteristics. Due to the identification of regularities and relationship between all the known field details, geologists and development engineers have an opportunity to adequately model the likely deposits.
The Varandey Field is a prime example of one of those deposits. It belongs to a complex of high geological heterogeneity and uncertain reservoirs. In other words, if we drill a well, the study of the surrounding area provides us with insight into the reservoir area, however the area between the wells remains unknown. The drilling of new wells, as well as planning and managing the spacing between the wells and around the field, is an extremely difficult and risky challenge. Since such operations require a lot of investment, risk minimization has to be an overriding priority.
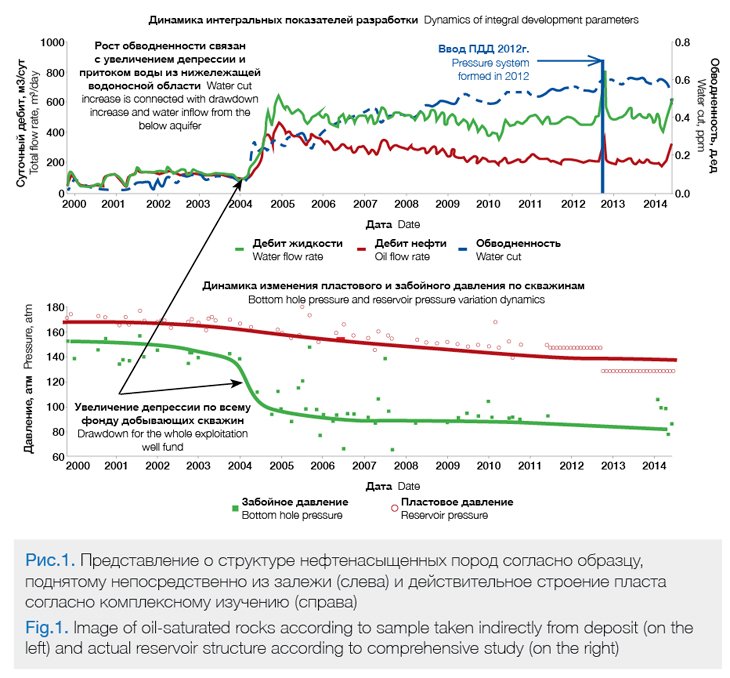
The article covers the initial data correlation method which allows for the description of the filtration parameters of one of the most complicated fields in the Timan-Pechora Basin. Why select the Varandey Field? The truth is that the oil recovery comes amid an active increase of water cut (Fig. 1), even though the period of Pla+s deposit exploitation is pretty short. As Figure 1 shows, in 2004 for the entire producing well stock, the reservoir pressure and wellbore pressure differential, at the reservoir depth, had been increased in order stimulate an active fluid inflow to the producing well. As a result of this, the oil flowing to the well was accompanied with a large amount of reservoir water. The question was: where did the water come from, if the reservoir pressure system (it is usually a water injection for oil displacement) was formed in late 2012? This study has been conducted to answer this question
A new approach to modeling these types of reservoirs helps our understanding that core permeability (Figure 2) is not at all that the deposit is.
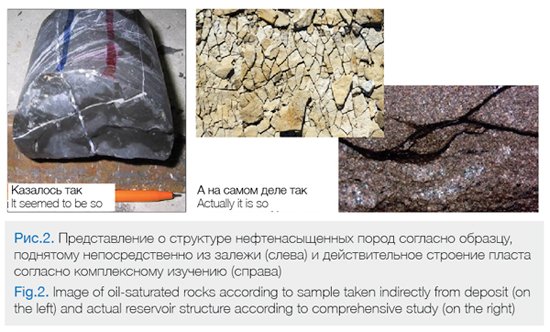
In many cases, as practice shows, with only having core samples from the Varandey Field, it is very difficult to understand whether the deposit has high permeability and fractures, or if they just represent a compact texture. This is related to the fact that the recovery of the samples from depth, where the oil-saturated rocks usually occur, is usually accompanied by their «stress refief». In other words, the change in the pressure from 2-3 km deep to surface conditions results in its partial destruction, i.e. loose and permeable rocks slough and its dense components are all that remains. This means that some additional information is needed, but which information exactly?
Such information may be represented by different seismic data, attributes, geophysical surveys of the wells, which show the changes in one or another geological parameters throughout the well’s length, and hydrodynamic studies. The latter makes it possible to determine the permeability of more than just the well area. The observation well testing makes possible to understand how well the oil is filtered in the interwell space.
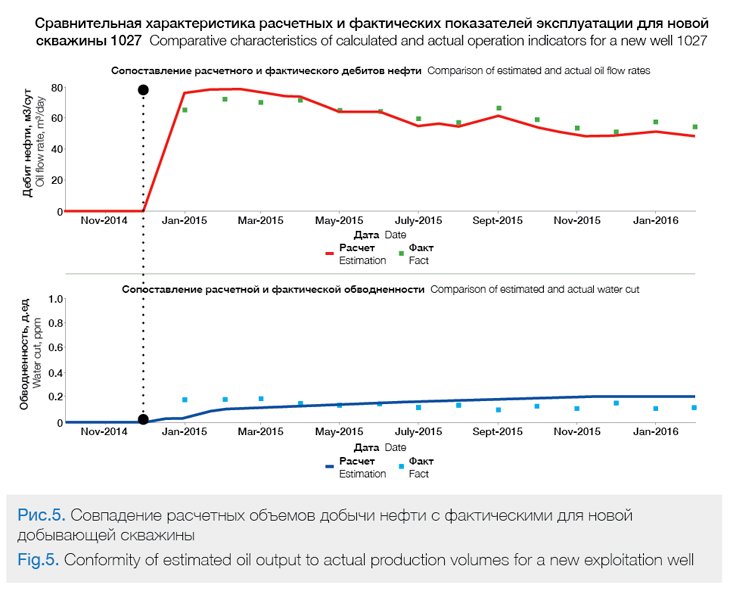
In this manner, the studies show the interactions between the seismic data, hydrodynamic well data showing the average permeability in the area of the exploitation well, and the comparison between these data sets with the operational characteristics from one of the operations wells. This allows not only to adequately describe the filtration structure of such reservoirs but also to correctly predict the input development parameters for newly drilled wells. This allows you to find the model and apply to the whole well.
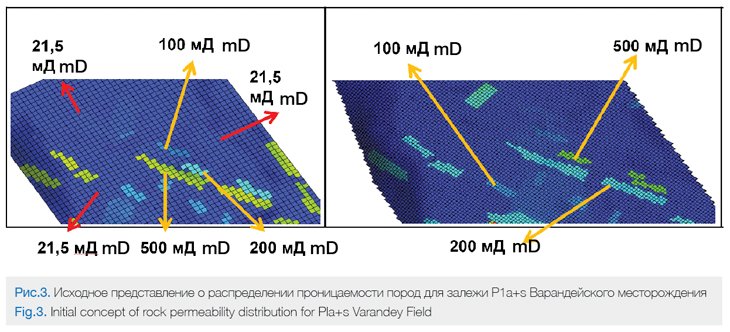
After correlating all the data we obtained the following image of reservoir permeability distribution: if the last time the permeability area looked as on Figure 3, now, after applying the new methods of initial data processing and integration, we receive what we have on Figure 4.
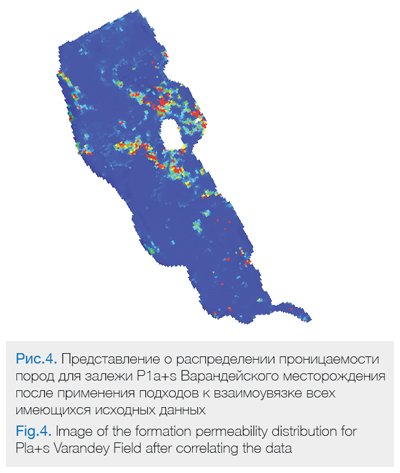
While the 3D model on Figure 3 did not show all aspects of the permeability changes between the wells, and just showed an approximate image of its structure, Figure 4 shows a more adequate image of change in reservoir filtration parameters. Certainly, in the latter case the oil and water occurring in the reservoir will move in some other directions.
Application of this method allowed building a new geologic and hydrodynamic model. The model gives an opportunity to reproduce the well and deposit operation history and predict flow rates of exploitation wells and injection capacity of injection wells with minimal errors.
This successful method of integration of seismic, hydrodynamic and geophysical studies may be used in other complicated LUKOIL fields in the nearest future.
The full results and outcomes from the modelling program, at the Varandy field, will be cover in future issues of ROGTEC as the results and impact become known.
Svetlana Sukhodanova, Lead Specialist for Gas Methods of Oil Recovery
Enhancement, LUKOIL Engineering LLC
M.V. Chertenkov, Deputy Director General for Oilfield Development Technologies,
LUKOIL-Engineering LLC
D.A. Mett, Chief Specialist, EOR Gas Methods Department, LUKOIL-Engineering LLC
I.Yu.Khromova, Independent Expert of the State Reserves Committee