Monitoring Leaks at Oil and Gas Facilities Using Satellites in Support of ESG Initiatives
The number of investment funds that incorporate Environmental, Social, and Governance (ESG) factors has been growing rapidly in the last twenty years. The ESG factors are a subset of non-financial performance indicators that include ethical, sustainable, and corporate governance issues. ESG is now a generic term used in capital markets to determine how far advanced companies are with sustainability efforts. It is now known that companies that fail to manage ESG risks have historically experienced higher costs of capital, increased volatility, and accounting irregularities.
Russia signed the Paris Agreement in December 2015 and ratified it in October 2019. On April 21, 2021, Russia’s president set a 30-year goal to have lower accumulated net greenhouse gas emissions than in the European Union. Russia’s greenhouse gas emissions are roughly half of the total 27 European Union countries, placing Russia as the world’s fourth largest greenhouse gas emitter (Reuters 2021).
Recently, Russia’s central bank has recommended domestic companies to disclose their ESG agendas in their annual reports and stated that it is essential to evaluate ESG-related risks, as there is a high probability they may transform into financial risks over time (Reuters 2021). The Russian institution is also considering issuing state green bonds. In Russia, the green finance market emerged in 2018. Green financing means providing finance, in the form of bonds, while enhancing the resource efficiency and reducing the impact on the environment and the global climate (Dubrova, et al. 2021). In order for a financial security to be considered “green”, a company needs to be recognized by the public and meet specific certification criteria. The principles for these criteria are well aligned with the ESG precepts.
According to Babkin et al., Russia is still lagging the global ESG trend and the awareness about ESG is extremely low (Babkin, et al. 2021). Dubrova, et al., states that Russia faces the problem of the lack of numerous organizations in the field of responsible investment, slowing the development of solutions to global problems (Dubrova, et al. 2021). A recent study by Ponomarenko et al., states that the assessment of sustainable development (SD), under the umbrella of corporate social responsibility (CSR), is difficult due to the lack of consensus within the existing methodologies and even definitions of key terms associated with the subject (Ponomarenko, et al. 2021). Ponomarenko’s study proposes a methodology for assessing corporate sustainability of oil and gas (O&G) by using social and environmental indicators. The developed methodology incorporated ESG indicators due to the significant impact that O&G companies have on the environment.
There is no doubt that in today’s emerging reality, ESG is important to the O&G industry, since governments, investors, and individuals are increasingly focused on issues pertaining to climate change, workforce conditions, and corporate governance. The increasing pressure to protect the environment should be at the forefront of the business decisions made by O&G companies. The issue of climate change and global warming is currently seen by the public as one of the greatest threats to humankind. Due to this, methane emissions have taken greater notoriety in recent years, and the O&G sector has been identified and targeted by the public and governments due to methane’s inherent presence in the production, transportation, storage, and distribution processes. Therefore, identifying and minimizing methane emissions from these processes will have a positive impact within the environment, public, governments, and in the O&G sector’s reputation and economies.
The E in ESG for O&G Companies
The integration of ESG factors is key in sustainable performance. The Environmental component looks at the analysis of the environmental footprint of a company. This includes assessments on waste, resource depletion, deforestation, climate change, and greenhouse emissions. The latter two are of special interest for this article.
Within the ESG framework, it is observed that indicators in the Environmental component, such as water consumption, waste production, energy consumption per unit, and GHG emissions, must achieved a minimization trend. Other indicators such as investment in environmental protection and O&G reserves must have a maximization priority.
The case for reduction of methane emissions
The reduction of methane emissions in O&G sector serves as a cost-effective method to decrease greenhouse gases (GHGs) while increasing energy security, enhancing economic growth, and improving air quality. It has been estimated that anthropogenic methane emissions contribute to about one-third of today’s GHG warming (Stocker, et al. 2013).
Due to methane high global warming potential (GWP) and short residence time in the atmosphere when compared to carbon dioxide (CO2), a reduction in methane emissions can efficiently have an impact in the shorter-term warming rate (Shoemaker, et al. 2013).
In the O&G sector, methane is mostly emitted during the production and transport of natural gas (United States Environmental Protection Agency 2019). A study performed in the Permian basin, United States, from September through November 2019, showed that 50 percent of detected emissions resulted from O&G production, while only 12 percent was attributable to processing, and 38 percent to gathering and boosting operations (Cusworth, et al. 2021). Therefore, identifying, capturing, and reducing emissions in these processes will contribute to a reduction of GHG emissions, hence supporting climate change mitigation efforts while increasing energy efficiency and supply.
Monitoring Methane from Space
The first artificial satellite, Sputnik, was placed into space on October 4, 1957. Since then, the use of satellites has expanded to monitor the earth, including weather and atmospheric compositions. In the last twenty years, large-scale patterns of methane emissions (natural and anthropogenic) have been detected with public, low-resolution satellites (Frankenberg, et al. 2005). However, methane emissions related to anthropogenic activities are associated with many relatively small point sources (Varon, Jacob, et al. 2018). For this, GHGSat, a private company with international presence, pioneered the use of high-resolution satellites to monitor methane emissions worldwide. The company launched the first proof-of-concept microsatellite, GHGSat-D, in June 2016, effectively measuring methane and carbon dioxide emissions from targeted facilities. That satellite continues to be fully operational and has served in the improvement of data retrieval, and enhancement of processing methodologies. These insights were incorporated in the development of the new generation sensor (Ligori, et al. 2019). This sensor technology has been focused to detect methane and was incorporated into GHGSat-C1 and GHGSat-C2, which were launched in September 2020 and January 2021, respectively.
GHGSat satellites are in orbit approximately 500 km from the ground. Therefore, understanding the instrument’s capabilities and depicting some examples of measurements performed by the satellites provides an idea of how this technology can be used in identifying methane emissions from O&G facilities and the impact in ESG metrics.
Instrument
The instrument in GHGSat’s satellites uses spectrometry to perform measurements of methane concentration in excess of background concentration. This technology allows to measure surface-level trace gases by collecting sunlight scattering off the earth.
The primary instrument is GHGSat’s patented sensor, which uses a Wide-Angle Fixed-cavity Fabry-Pérot (WAF-P) etalon imaging spectrometer. The WAF-P etalon uses reflections between two closely separated mirrors that partially reflect and transmit instant light. This transmitted light is then focused by a lens onto an imager (screen), which produces what is known as interference pattern. Interference occurs when two or more waves superimpose. The amplitude of the waves and its corresponding positions at each point in space are combined to form a single resultant wave. This produces a pattern of bright and dimmer bands. The brightness of these bands is determined by the extent these waves constructively interfere. Complete constructive interference results in the brightest bands, while partially constructive interference results in a dimmer band. The molecules in the light’s path will absorb a certain pattern of wavelengths, leaving dark bands in the spectrum. The dark bands can be detected from orbit once the concentration of molecules increases.
In GHGSat’s imaging system the radius of the ring on the imager is approximately proportional to the ray angle. This makes the etalon to behave as an angle-dependent filter. So rather than dispersing the light by wavelength, we filter the light to specific wavelengths, depending on the light’s radial position within the scene. Figure 1 shows a schematic of the imaging system.
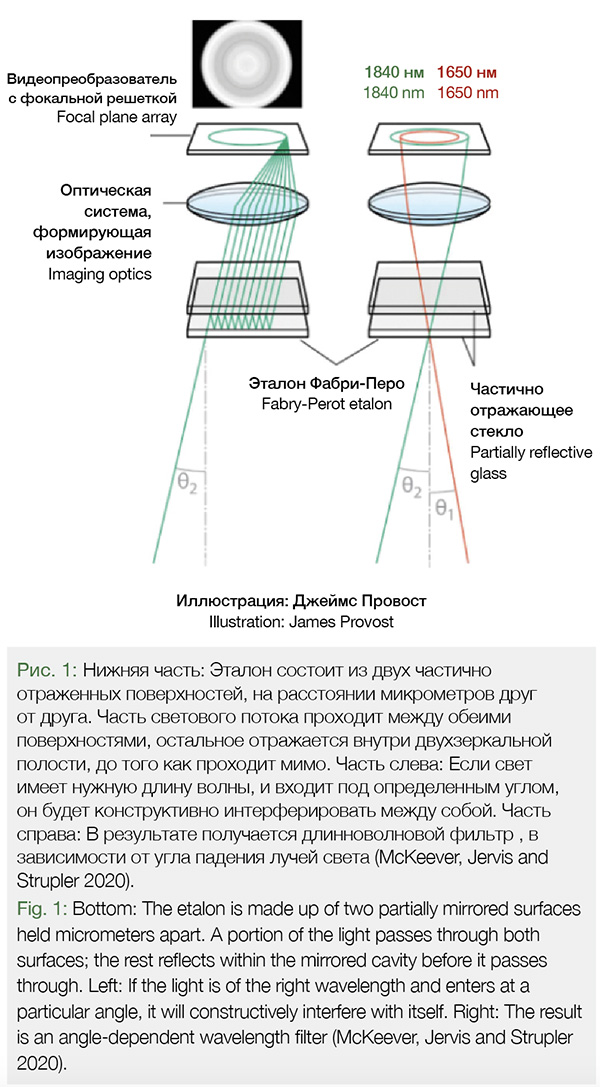
In addition to the WAF-P, the optical design of the instrument includes three lens groups, as well as beam folding mirrors required to fit the telescope within a microsatellite bus. This spectrometer is capable of resolving methane absorption lines in the shortwave infrared (SWIR; (Jervis, et al. 2021)). The spectral range for methane detection is at 1600-1700 nanometers (nm), with multiple bands in a proprietary configuration. This configuration provides accurate methane concentration values for over 200,000 pixels in each image.
Observations from GHGSat-C1 and GHGSat-C2
The satellites designed by GHGSat operate in a sun-synchronous polar orbit at an altitude of approximately 500 km. The nominal detection threshold for GHGSat-C1 and GHGSat-C2 is 100 kilogram of methane per hour (kg·hr-1), in moderate wind conditions. Each satellite is designed to offer a 25-meter resolution in an approximately 12 kilometers (km) by 12 km field of view (FOV). Each pixel in the emissions retrieval provide a concentration measurement, which is then represented with a false-color overlay corresponding to the calculated concentration in the examples of concentration maps below.
Figure 2 depicts a measurement on September 25, 2020, by GHGSat C-1. The site of the measurement corresponds to an O&G facility located in New Mexico, USA. The resolution of GHGSat-C1 measurement enables to accurately attribute the source of the detected methane emission. The background (third-party imagery) shows a heavily dense area, mostly O&G infrastructure owned and operated by different companies near one another. The colorimetry of the plume concentration references the methane column-average concentration in excess of the local background level. In this event, the highest concentration were near 200 parts per billion (ppb). The calculated mass emission rate was estimated at 1,190 kg·hr-1± 476 kg·hr-1.
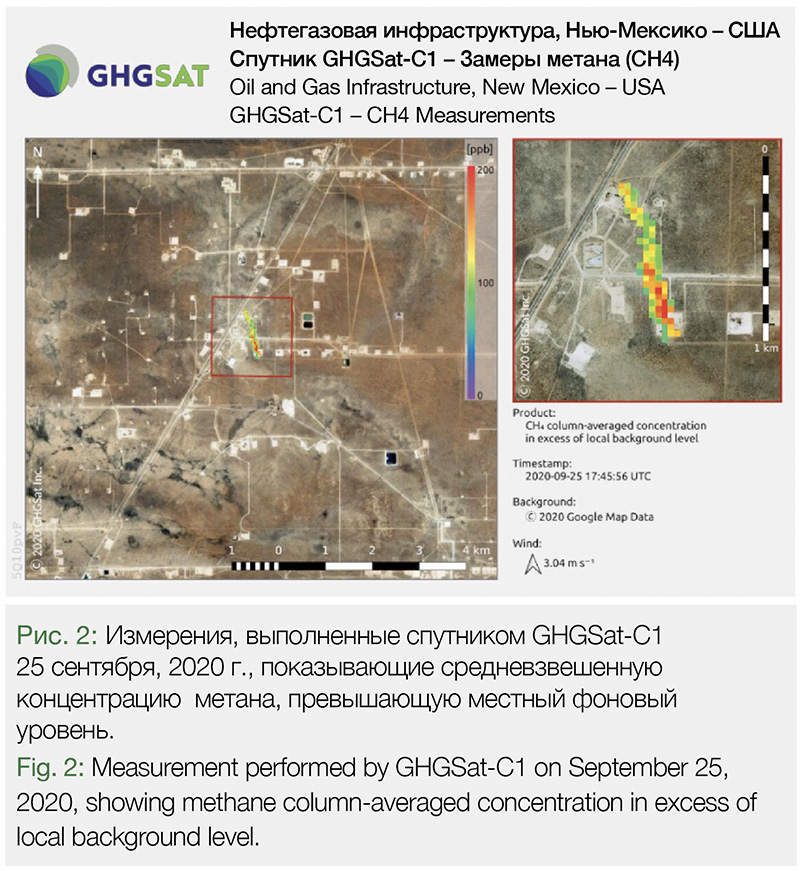
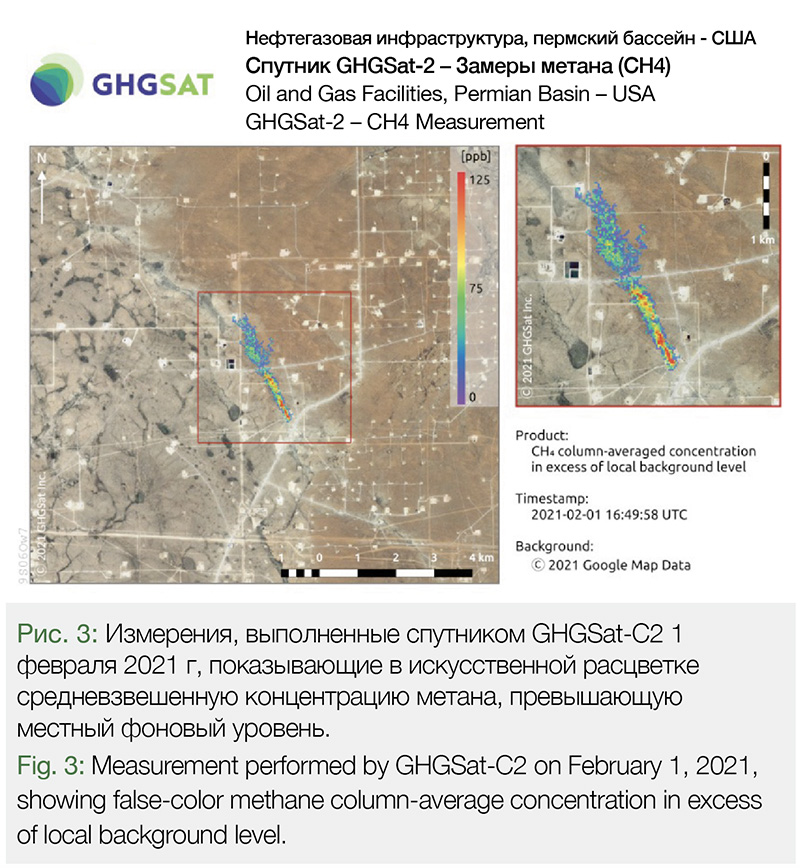
Figure 3 below shows a measurement made by GHGSat-C2. The region is comparable with that in Figure 2, showing multiple O&G infrastructure (all possible sources of emissions) in the FOV. Source attribution was effectively allocated, with a highest methane column-averaged concentration (in excess of the local background level) around 125 ppb. The calculated mass source rate was 1250 kg·hr-1 ± 437 kg·hr-1.
From these measurements, the mass emission rate was estimated by using the integrated methane enhancement (IME) method utilized by Varon et al (Varon, Jacob, et al. 2018). The variability in the computation of the source mass rate (Q) is highly dependent on the localized wind data (Varon, Jacob, et al. 2018), (Varon, Jervis, et al. 2021).
The measurements depicted in Figures 3 and 4 provide evidence of effectiveness and geolocation precision of these instruments. However, confirmation of emission rate is dependent on the operator reporting back on their findings when visiting the site. Consequently, validation of the methodology and computation is best achieved by participating in controlled releases.
Controlled Release
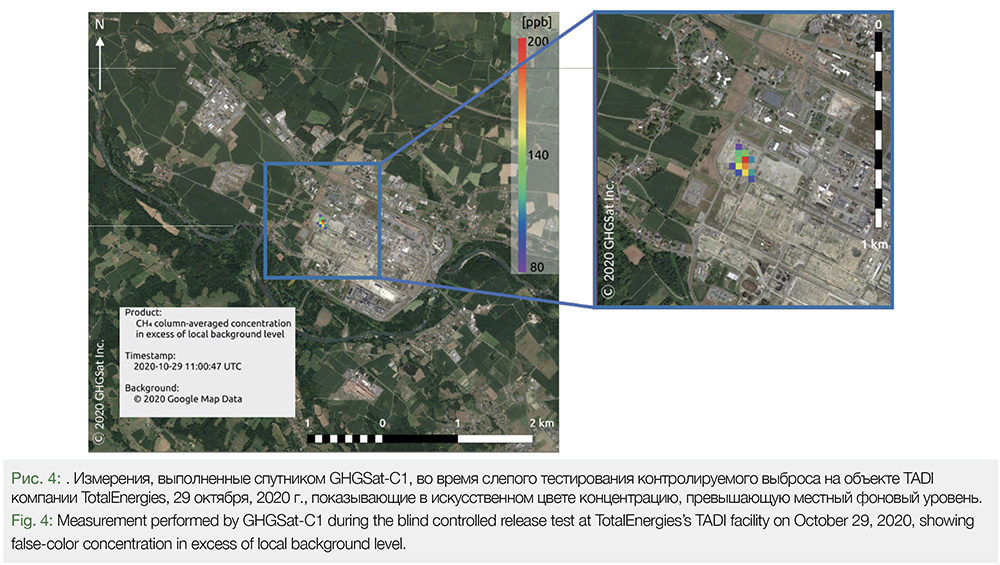
In partnership with TotalEnergies, GHGSat participated in a blind controlled release test on October 29, 2020. The test location and release amount were controlled by TotalEnergies and unknown to GHGSat. After the passing of GHGSat-C1 over the area, the leak was detected and identified in the corresponding coordinates where the source of the release was located. Assessment of the methane’s column-averaged concentration above background was as high as 200 ppb. The quantification of the source mass rate (Q) was 250 kg·hr-1 ± 140 kg·hr-1. The ground truth release rate was 234 kg·hr-1. Figure 4 depicts the false-color methane concentration overlayed on a base map imagery of the location.
Conclusion
Investing in ESG does not necessarily imply that profitability is compromised in support of superior ambitions. There are multiple benefits to implementing ESG factors into the operations of an O&G company. Some of these benefits such as improving corporate reputation and building consumer confidence may seem intangible at the beginning, but they can have a lasting positive impact on the company and the sector. Companies in Russia and throughout the world are now advised by the investment community to disclose sustainability reports, as they can be utilized for risk identification, assessment of long-term investment opportunities, and understanding of the environmental activities associated with greenhouse emissions and global warming.
Since the atmospheric concentration of methane has increased over the last century and continues to increase (Wuebbles and Hayhoe 2002), it is of the upmost relevance to incorporate ways for identifying and minimizing methane emissions associated with the O&G processes. Measurements of atmospheric concentrations of methane from ground, aircraft, and satellite platforms can be used to infer total methane emissions in a region (Allen 2014). However, current ground-based leak detection and repair (LDAR) technologies can achieve low detection thresholds but are limited in the frequency and spatial coverage. When this technology is used in a more frequent basis, the cost-benefit relation becomes far from optimal. An effective tiered monitoring program includes technologies with different capabilities that can be deployed at varying frequencies to optimize coverage and cost. Satellite measurements, like the ones from GHGSat, can assist in the quick detection of methane emissions of concern across large spatial and temporal scales. This can be used in conjunction with airplane campaigns whose detection threshold lowers and resolution increases as measurements are made closer to the ground (Esparza and Gauthier 2021). Drone technology and ultimately optical gas imaging (OGI) measurements will help in finding the smaller emission sources. The limitation on revisit time for satellite measurements can be addressed by increasing the number of satellites in the constellation. GHGSat plans to add at least eight more satellites by the end of 2022, hence, increasing the frequency of measurement and effectively shortening the time between measurement opportunities.
References
Allen, David T. 2014. «Methane emissions from natural gas production and use: reconciling bottom-up and top-down measurements.» Current Opinion in Chemical Engineering (Elsevier) 5: 78-83. doi:https://doi.org/10.1016/j.coche.2014.05.004.
Babkin, Alexander, Ekaterina Malevskaia-Malevich, Nadezhda Kvasha, and Evgenii Eliseev. 2021. «The relationship between socially responsible investment and the market value of an enterprise.» E3S Web of Conferences. SDGG. doi:https://doi.org/10.1051/e3sconf/202129101002.
Brandt, Adam R., Garvin A. Heath, and Daniel Cooley. 2016. «Methane leaks from natural gas systems follow extreme distributions.» Environmental Science and Technology. doi:DOI: 10.1021/acs.est.6b04303.
Cusworth, Daniel H., Riley M. Duren, Andrew K. Thorpe, Winston Olson-Duvall, Joseph Heckler, John W. Chapman, Michael L. Eastwood, et al. 2021. «Intermittency of large methane emitters in the Permian basin.» Environmental Science and Technology Letters. doi:https://doi.org/10.1021/acs.estlett.1c00173.
Dubrova, M. V., L. V. Gusarova, N. N. Zhylina, M. R. Shamsutdinova, and V. G. Ignatyev. 2021. «Financial instruments of «green» economy development in Russia.» E3S Web of Conferences. ITEEA. doi:https://doi.org/10.1051/e3sconf/202126204002.
Esparza, Ángel E., and Jean-François Gauthier. 2021. «Monitoring leaks at oil and gas faciities using the same sensor on aircraft and satellite platforms.» SPE/AAPG/SEG Unconventional Resources Technology Conference. Houston. doi:https://doi.org/10.15530/urtec-2021-5666.
Frankenberg, C., J. F. Meirink, M. van Weele, U. Platt, and T. Wagner. 2005. «Assessing methane emissions from global space-borne observations.» Science 308 (5724): 101-1014. doi:DOI: 10.1126/science.1106644.
Jervis, Dylan, Jason McKeever, Berke O.A. Durak, James J. Sloan, David Gains, Daniel J. Varon, Antoine Ramier, Mathias Strupler, and Ewan Tarrant. 2021. «The GHGSat-D imaging spectrometer.» Atmospheric Measurement Techniques (EGU) 14: 2127-2140. doi:https://doi.org/10.5194/amt-14-2127-2021.
Karion, Anna, Colm Sweeney, Eric A. Kort, Paul B. Shepson, Alan Brewer, Maria Cambaliza, Stephen A. Conley, et al. 2015. «Aircraft-based estimate of total methane emissions from the Barnett shale region.» Environmental Science and Technology 49: 8124-8131. doi:https://doi.org/10.1021/acs.est.5b00217.
Ligori, Michael, Laura Bradbury, Robert Spina, Robert E. Zee, and Stephane Germain. 2019. «GHGSat Constellation: The future of Monitoring greenhouse gas emissions.» 33rd Annual AIAA/USU Conference on Small Satellites.
McKeever, Jason, Dylan Jervis, and Mathias Strupler. 2020. «Spotting mystery methane leaks from space.» IEEE Spectrum, October 27. Accessed August 08, 2021. https://spectrum.ieee.org/spotting-mystery-methane-leaks-from-space.
Peischl, J., A. Karion, C. Sweeney, E. A. Kort, M. L. Smith, A. R. Brandt, T. Yeskoo, et al. 2016. «Quantifying atmospheric methane emissions from oil and natural gas production in the Bakken shale region of North Dakota.» Journal of Geophysical Research: Atmospheres 121: 6101-6111. doi:10.1002/2015JD024631.
Ponomarenko, Tatyana, Oksana Marinina, Marina Nevskaya, and Kristina Kuryakova. 2021. «Developing corporate sustainability assessment methods for oil and gas companies.» Economies (MDPI) 9 (58). doi:https://doi.org/10.3390/economies9020058.
Reuters. 2021. «Putin calls for Russian greenhouse gas emissions to be lower than EU’s.» Reuters – Environment, April 21. Accessed 08 05, 2021. https://www.reuters.com/business/environment/putin-says-russias-greenhouse-gas-emissions-should-be-lower-than-eus-2021-04-21/. —. 2021. «Russia’s central bank adivses companies to disclose ESG agenda.» Reuters – Sustainable Business, July 19. Accessed August 05, 2021. https://www.reuters.com/business/sustainable-business/russias-central-bank-advises-companies-disclose-esg-agenda-2021-07-19/.
Schwietzke, Stefan, Gabrielle Pétron, Stephen Conley, Cody Pickering, Ingrid Mielke-Maday, Edward J. Dlugokencky, Pieter P. Tans, et al. 2017. «Improved mechanistic understanding of natural gas methane emissions from spatially resolved aircraft measurements.» Environmental Science and Technology 51: 7286-7294. doi:https://doi.org/10.1021/acs.est.7b01810.
Shoemaker, J. K., D. P. Schrag, M. J. Molina, and V. Ramanathan. 2013. «What role for short-lived climate pollutants in mitigation policy?» American Association for the Advacement of Science 342 (6164): 1323-1324. doi:https://doi.org/10.1126/science.1240162.
Stocker, Thomas F., Qin Dahe, Gian-Kasper Plattner, M. Tignor, and S.K. Allen. 2013. IPCC, 2013: Climate Change 2013: The Physical Science Basis. Contribution of Working Group I to the Fifth Assessment Report of the Intergovernmental Panel on Climate Change. Cambridge, United Kingdom and New York, NY, USA,: Cambridge University Press.
United States Environmental Protection Agency. 2019. «Global Non-CO2 Greenhouse Gas Emission Projections & Mitigation: 2015-2050.» https://www.epa.gov/global-mitigation-non-co2-greenhouse-gases.
Varon, Daniel J., Daniel J. Jacob, Jason McKeever, Dylan Jervis, Berke O. A. Durak, Yan Xia, and Yi Huang. 2018. «Quantifying methane point sources from fine-scale satellite observations of atmospheric methane plumes.» Atmospheric Measurement Techniques 11: 5673-5686. doi:https://doi.org/10.5194/amt-11-5673-2018.
Varon, Daniel J., Dylan Jervis, Jason McKeever, Ian Spence, David Gains, and Daniel J. Jacob. 2021. «High-frequency monitoring of anomalous methane point sources with multispectral Sentinel-2 satellite observations.» Atmospheric Measurement Techinques 14: 2771-2785. doi:https://doi.org/10.5194/amt-14-2771-2021.
Wuebbles, Donald J., and Katharine Hayhoe. 2002. «Atmospheric methane and global change.» Earth-Science Revies (Elsevier Science B.V.) (57): 177-210.
Yacovitch, Tara I., Scott C. Herndon, Joseph R. Roscioli, Cody Foerchinger, Ryan M. McGovern, Michael Agnese, Gabrielle Pétron, et al. 2014. «Demonstration of an ethane spectrometer for methane source identification.» Environmental Science Techoncology 48: 8028-8034. doi:https://doi.org/10.1021/es501475q.
Authors
Ángel E. Esparza1, Ryan Mattson2 – rmattson@ghgsat.com, and Jean-François Gauthier3
1 GHGSat, Inc., Houston, TX, USA – Corresponding Author
2 GHGSat, Inc., Calgary, AB, Canada
3 GHGSat, Inc., Montréal, QC, Canada