Novatek: 9M Results 2018 – Revenue Up 99.2% yoy as Additional Trains Come on Stream

PAO NOVATEK today released its consolidated interim condensed financial statements as of and for the three and nine months ended 30 September 2018 prepared in accordance with International Financial Reporting Standards (“IFRS”).
(in millions of Russian roubles except as stated)
|
3Q18
|
3Q17
|
|
9M18
|
9M17
|
|
217,934
|
129,970
|
Oil and gas sales
|
591,237
|
412,001
|
|
1,432
|
733
|
Other revenues
|
3,354
|
2,160
|
|
219,366
|
130,703
|
Total revenues
|
594,591
|
414,161
|
|
(156,903)
|
(94,385)
|
Operating expenses
|
(423,546)
|
(297,782)
|
|
–
|
–
|
Net gain on disposal of
interests in joint ventures
|
1,645
|
–
|
|
(485)
|
(222)
|
Other operating income (loss)
|
(1,004)
|
403
|
|
61,978
|
36,096
|
Profit from operations*
|
170,041
|
116,782
|
|
70,744
|
45,094
|
Normalized EBITDA of subsidiaries*
|
196,123
|
142,707
|
|
118,091
|
59,270
|
Normalized EBITDA including share in EBITDA of joint ventures*
|
295,736
|
183,522
|
|
14,560
|
5,061
|
Finance income (expense)
|
27,342
|
9,873
|
|
(11,942)
|
6,875
|
Share of profit (loss) of joint ventures,
net of income tax |
(28,994)
|
16,733
|
|
64,596
|
48,032
|
Profit before income tax
|
170,034
|
143,388
|
|
45,900
|
37,737
|
Profit attributable to
shareholders of PAO NOVATEK
|
121,062
|
111,998
|
|
65,522
|
34,905
|
Normalized profit attributable to
shareholders of PAO NOVATEK ** |
166,721
|
113,022
|
|
21.75
|
11.57
|
Normalized basic and diluted earnings per share** (in Russian roubles)
|
55.31
|
37.47
|
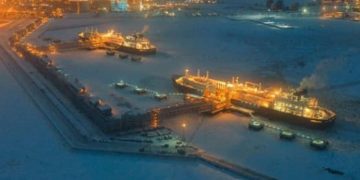
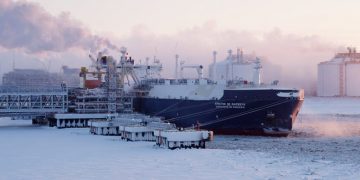
In the third quarter of 2018, our total revenues amounted to RR 219.4 billion and Normalized EBITDA, including our share in EBITDA of joint ventures, totalled RR 118.1 billion, representing increases of 67.8% and 99.2%, respectively, as compared to the corresponding period in 2017. Our total revenues and Normalized EBITDA, including our share in EBITDA of joint ventures, during the nine months ended 30 September 2018 amounted to RR 594.6 billion and RR 295.7 billion, representing increases of 43.6% and 61.1%, respectively, as compared to the prior year reporting period. The increases in our total revenues and Normalized EBITDA were largely due to the production launches of the first and the second LNG trains at Yamal LNG at the end of 2017 and in July 2018, respectively, as well as a favourable macro-economic environment with increases in average realized liquids and natural gas prices.
In the third quarter and the nine months of 2018, profit attributable to shareholders of PAO NOVATEK increased to RR 45.9 billion (RR 15.23 per share), or by 21.6%, and to RR 121.1 billion (RR 40.17 per share), or by 8.1%, respectively, as compared to the corresponding periods in 2017. Our profit in the reporting periods was significantly impacted by the recognition of substantial non-cash foreign exchange effects on foreign currency denominated loans of the Group and its joint ventures. Excluding the effect of foreign exchange differences, as well as the one-time effect from the disposal of interests in joint ventures, Normalized profit attributable to shareholders of PAO NOVATEK totaled RR 65.5 billion (RR 21.75 per share) in the third quarter of 2018 and RR 166.7 billion (RR 55.31 per share) in the nine months of 2018, representing increases of 87.7% and 47.5%, respectively, as compared to the corresponding periods in 2017.
|
3Q18
|
3Q17
|
|
9M18
|
9M17
|
|
138.0
|
125.3
|
Total hydrocarbon production,
million barrels of oil equivalent (million boe)
|
402.2
|
383.3
|
|
1.50
|
1.36
|
Total production (million boe per day)
|
1.47
|
1.40
|
|
17,386
|
15,434
|
Natural gas production including proportionate share in the production of joint ventures, million cubic meters (mmcm)
|
50,312
|
47,346
|
|
10,524
|
10,495
|
Natural gas production by subsidiaries
|
31,449
|
32,706
|
|
4,133
|
2,165
|
Natural gas purchases from joint ventures
|
16,140
|
9,822
|
|
2,439
|
2,407
|
Other purchases of natural gas
|
5,876
|
6,203
|
|
17,096
|
15,067
|
Total natural gas production by subsidiaries and purchases (mmcm)
|
53,465
|
48,731
|
|
2,911
|
2,921
|
Liquids production including proportionate share in the production of joint ventures,
thousand tons (mt) |
8,775
|
8,806
|
|
1,631
|
1,683
|
Liquids production by subsidiaries
|
4,909
|
5,083
|
|
2,220
|
2,312
|
Liquids purchases from joint ventures
|
6,842
|
6,951
|
|
178
|
53
|
Other purchases of liquids
|
278
|
131
|
|
4,029
|
4,048
|
Total liquids production by subsidiaries
and purchases (mt)
|
12,029
|
12,165
|
|
3Q18
|
3Q17
|
|
9M18
|
9M17
|
|
15,589
|
13,888
|
Natural gas (mmcm)
|
51,001
|
47,020
|
|
including:
|
||||
|
13,766
|
13,888
|
Sales in the Russian Federation
|
47,567
|
47,020
|
|
1,823
|
–
|
Sales on international markets
|
3,434
|
–
|
|
3,934
|
3,720
|
Liquids (mt)
|
11,984
|
11,905
|
|
including:
|
||||
|
1,552
|
1,477
|
Stable gas condensate refined products
|
5,146
|
5,077
|
|
1,134
|
1,108
|
Crude oil
|
3,405
|
3,391
|
|
679
|
656
|
Liquefied petroleum gas
|
1,986
|
1,978
|
|
566
|
475
|
Stable gas condensate
|
1,438
|
1,449
|
|
3
|
4
|
Other petroleum products
|
9
|
10
|
Our operational results for the third quarter and the nine months of 2018 were significantly impacted by the production launches of the first and the second LNG trains at Yamal LNG at the end of 2017 and in July 2018, respectively, as well as the acquisitions of new producing fields at the end of 2017 and in the first quarter of 2018 (the Beregovoye, the West-Yaroyakhinskoye and the Syskonsyninskoye fields). As a result, our total natural gas production for the third quarter and the nine months of 2018 increased by 12.6% and 6.3%, respectively, and our total liquids production decreased marginally by 0.3% and 0.4%, respectively.
In the third quarter and the nine months of 2018, our natural gas sales volumes totaled 15.6 billion and 51.0 billion cubic meters (bcm), representing increases of 12.2% and 8.5%, respectively, as compared to the corresponding periods in 2017. The increases were primarily due to sales of LNG purchased from our joint venture Yamal LNG to international markets. As at the end of the third quarter of 2018, we recorded 2.4 bcm of natural gas in inventory balances relating mainly to natural gas in the Underground Gas Storage Facilities and LNG in transit, compared to 1.4 bcm at the end of the third quarter of 2017.
In the third quarter and the nine months of 2018, our liquid hydrocarbons sales volumes amounted to 3.9 million and 12.0 million tons, representing increases of 5.8% and 0.7%, respectively, as compared to the corresponding periods in 2017, mainly due to changes in inventory balances. As at 30 September 2018, we recorded 850 mt of liquid hydrocarbons in transit or storage and recognized as inventory as compared to 969 mt at 30 September 2017. Our liquid hydrocarbon inventory balances tend to fluctuate period-on-period and are usually realized in the following reporting period.
|
|
30 Septembe 2018
|
31 December 2017
|
|
ASSETS
|
|
|
|
Non-current assets
|
933,138
|
890,726
|
|
Property, plant and equipment
|
384,551
|
360,051
|
|
Investments in joint ventures
|
253,949
|
285,326
|
|
Long-term loans and receivables
|
254,640
|
211,901
|
|
Current assets
|
265,860
|
153,436
|
|
Total assets
|
1,198,998
|
1,044,162
|
|
LIABILITIES AND EQUITY
|
|
|
|
Non-current liabilities
|
214,870
|
184,545
|
|
Long-term debt
|
162,496
|
141,448
|
|
Current liabilities
|
139,949
|
83,958
|
|
Total liabilities
|
354,819
|
268,503
|
|
Equity attributable to
PAO NOVATEK shareholders |
824,380
|
757,839
|
|
Non-controlling interest
|
19,799
|
17,820
|
|
Total equity
|
844,179
|
775,659
|
|
Total liabilities and equity
|
1,198,998
|
1,044,162
|