REnergyCO: Russian OFS in Global Context
It is important, for many reasons, to understand the global strategic context for an OFS company. One of the key reasons is that the oil and gas industries are becoming increasingly multinational, LNG adds significantly to the globalization of the sector. Hence stakeholders must take the interconnectivity of the markets into account. The second reason is oil price – a commonly accepted and understood common denominator. Target oil price is the key parameter for making decisions from individual companies to the top industry regulators, governments, and supranational bodies.
In most places, the OFS industry remains a mix of local suppliers and international expertise often operating in regional silos. This combination allows for technology and know-how transfers between continents. However, the understanding of the global OFS context among decision-makers, on all levels, is limited. One of the most common fallacies in economic analysis is the fallacy of composition. However deep is our specific expertise, intuitively we tend to extend our experiences onto the world and inevitably make strategic mistakes. The limited availability of data in some cases and its unstructured abundance in others, makes the confusion even more profound.
From a traditional oilfield services perspective, it is common to view the OFS market in simplified modes such as land, shallow offshore, and deep offshore. This simplification contributes to over generalizations. However, the diversity of the geological conditions and technology applications coupled with strategic industry management makes this simplification redundant. This article outlines the strategic differences in the main producing regions and assesses the perspectives without prejudice or advice to individual countries.
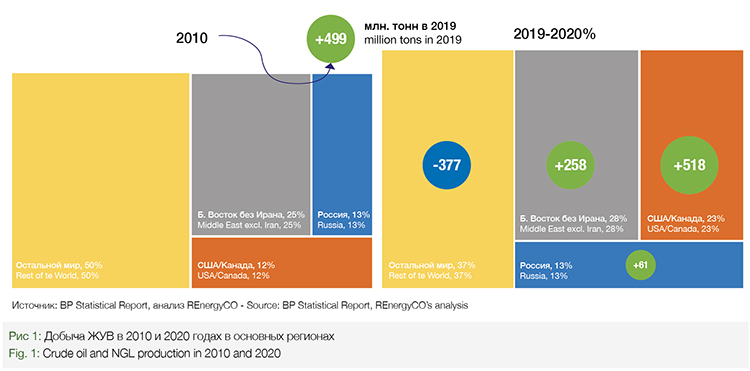
Before the COVID crisis, the global oil industry added almost half a billion tons of annual production growing by 1.3% per annum on average from 2010 to 2019. Liquids’ production growth was not a uniform global phenomenon. Two very different regions increased annual production by 776 million tons, Russia added 61 million tons while the rest of the world’s output fell by 337 million. The USA and Canada’s annual production was, by a staggering, 518 million tons higher than in 2010. Their global share leaped from 12% to 23%. The Middle East (excluding Iran) added an impressive 258 million tons. Some countries with vast traditional reserves were losing ground and opening the field to new oil from the USA and Canada. Falling production in Venezuela and Libya was reinforced by sanctions on Iran in 2019.
Global gas production grew twice as fast as oil, averaging 2.6% per annum from 2010 to 2019 with LNG growing at almost 5% per annum. The USA increased its production faster than any other region, but its share of the global market grew less dramatically than in the global oil market. The rapid development of the gas markets left room for growth for all the major players with the most notable additions in the Middle East and Iran. LNG projects became a key driver of the growth in both global gas consumption and OFS spending. LNG production in the US grew from almost zero in 2010 to 61 million tons in 2020, Russia and Qatar added 27 and 28 million accordingly. Australia increased output by 80 million tons and became the largest supplier of LNG in the world. In 2022, Operators in the US will complete additional trains making the country the largest supplier of LNG in the world. Natural gas will continue to be a crucial part of future upstream developments in all regions.
The three mega-regions under review are very different from an oil and gas industry management viewpoint. Ranging from the direct state control of the industry in the Middle East to the free market environment in the US and Canada, the industry’s management is seemingly targeting the same key outcome, to maximizing long-term
monetization of the reserves in place. Russia’s position is somewhere in the middle in terms of ownership but is closer to the Middle East in terms of tax collection. At the same time, the individual regions are positioned very differently, globally. They are defined by the role of the oil and gas revenues in the domestic economy and their managerial modus operandi. These differences directly impact the OFS businesses in their local and global context.
At this point, we need to define the scope of the discussion in this analysis. The OFS market, in this article, is defined as core business lines of the OFS majors and drilling companies that include both portions of CAPEX and some OPEX. Major CAPEX costs such as processing facilities, offshore platforms, and pipelines are excluded from the discussion. Accordingly, the estimates account for varying levels of CAPEX from a high share in the American shale oil and a low share in a sour gas project in the UAE offshore sector.
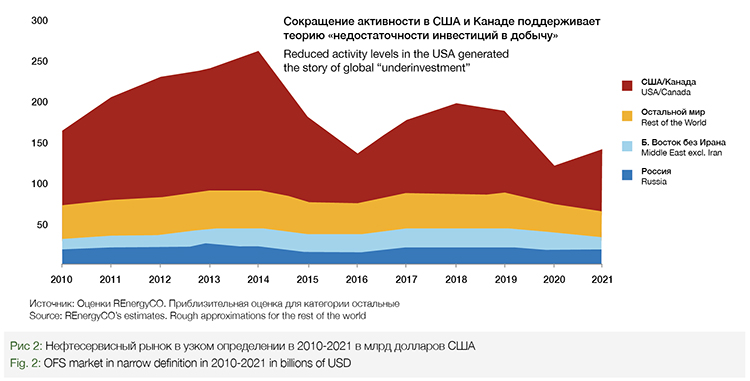
After peaking at around $270 billion in 2014 the OFS market, in our narrow definition, collapsed to around $150 billion in 2016. It bounced back to around $180-200 billion in 2017-2019 on prices supported by the OPEC+ agreement and increased activity in the US/Canada. Then came COVID with its annoying lockdowns, restricted travel, and lower business activity. The OFS market declined again. Weak recovery in 2021 sparked the discussion about underinvested oil industry underpinning high oil prices.
The USA and Canada provided for most of the variations in the market in the last ten years. The region delivered most of the global production growth and accounted for just 23% of liquids output in 2020. That share is comparatively low considering the scope of OFS spending. Changes in the oil price triggered shifts in activity levels in this region. This impacted the global OFS industry due to the sheer size of the regional business. Lower activity and OFS spending in 2015-2019 in the US/Canada did not result in the reduction of output. Quite the opposite in fact, a spectacular average 11% per annum growth in liquids production happened in the US despite moderate activity levels.
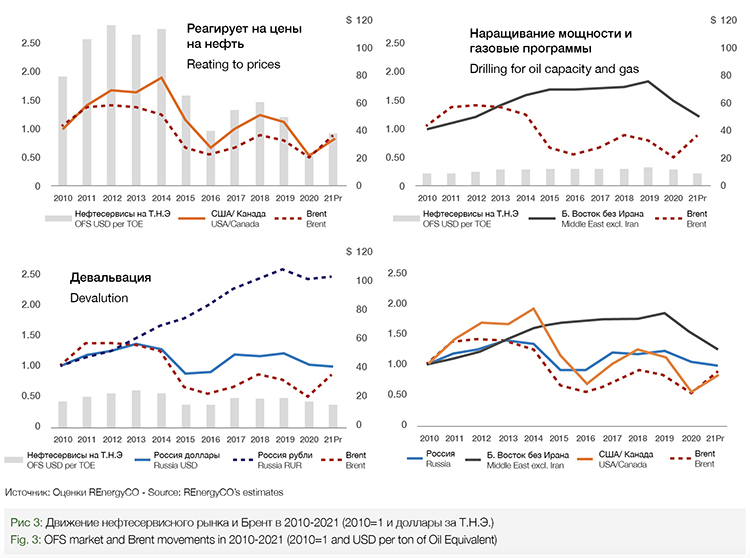
The heavy dependence of the global OFS market on US/Canada activity levels and the resilience of production in the region raises several questions. What are the required levels of activity and OFS spending required in order to sustain or grow production in the US/Canada? What is the impact on the other two key global suppliers? The former question has an answer: technology application shifts in the US reduced the required investment levels. The impact on the other two regions requires a separate discussions as they use different approaches to production, production capacity management, and changes in crude oil prices (differences in Figure 3).
The US and Canada went through a dramatic transition in the past ten years. The average OFS spending per TOE (Ton of Oil Equivalent) (which excludes facilities and pipelines as explained earlier) declined from an estimated $110 per ton in 2011-2014 to around $50 in the 2015-2021 cycle (from around $16 BOE to $7.5 BOE accordingly). Two factors contributed to the decline: improvements in OFS productivity as measured by the production of new wells and the reduced OFS costs. Shale oil and gas geological specifics allowed for the application and extension of new technics without any loss to underline production capacity. The key driving factors in productivity growth was not from drilling new wells but rather from increasing the lateral lengths and fracturing intensity. Canadian sands, on the other hand, improved everyday efficiencies through increased scale of operations and are competitive even in the ultra-low-price environment. Light shale oil and heavy oil from Canadian sands are complimentary and suit domestic refining reasonably well.
In the past US and Canada OFS activity heavily depended on oil and gas price levels. In 2021 the heads of some of the largest shale oil companies pledged to provide reasonable and steady activity levels to assist OPEC+ with maintaining high oil prices. However, the diverse and fragmented industry, with many individual entities involved, is unlikely to maintain calm and let an opportunity slip away. One private operator in Texas told the author that he will drill if oil went to $40 bbl. Indeed, the rig count in January 2022 reached 790 rigs (WTI over $80 bbl) compared to 535 in January 2021 (WTI at $52 bbl). In other words, activity, in terms of rigs, grew at the same pace as oil price in the period with 47% more rigs drilling at a 53% higher oil price. It is important to remember that today’s rig productivity is very different from a rig in 2012 with a much higher hydrocarbon output per well (more wells drilled with higher productivity per well).
The US shale industry will continue to react to oil prices. If the price range is moderate to high, then the industry will continue to increase output. There is also an additional upside for the shale producers with natural gas. Over the last ten years, domestic natural gas prices were depressed, but the fast development of the LNG capacity will ease low price pressures. High global prices will intensify new LNG additions. The OFS industry in the US will recover again amid high prices but at a much lower level than in 2014. The Canadian oil and gas industry requires a longer lead time in its oil sand development. At the same time, several large projects will start producing regardless of the oil price situation.
The summary for the North American OFS market: elastic to oil price (turbulent environment), declining OFS activity levels per ton of production (downside), highly competitive and open environment (upside), variable profitability (downside).
OFS activity in Russia grew steadily in 2010-2020 from the low 19 million meters of footage at the beginning of the period to around 30 million meters in 2018-2020. Russian activity levels expressed in footage and local currency did not react much to external factors such as oil prices in 2010-2020. OFS expenditure grew on average by around 9% per annum. The low elasticity of the Russian OFS market is explained by their progressive taxation scheme that makes the level of oil prices almost irrelevant and devaluation which reduces the near-term impact of declining revenues. Of course, there are many tax breaks and loopholes that allow increasing profitability amid high oil prices. Devaluation on the other hand has negative long-term effects in delayed inflation and high costs of imported equipment. During the 2015-2016 crisis in the US/Canada eased price pressures for critical technologies. The situation repeated itself in the 2020 slump and falling global prices, but this situation may change in the future when key technology suppliers adjust to lower demand in the US. The adjustments will inevitably normalize prices and returns of technology suppliers globally.
The Russian OFS industry was lucky in 2020 compared to its American counterparts. OFS activity levels remained high in most segments except for reductions in exploratory drilling. Oil companies preferred to cut production from existing wells rather than reduce activity levels. This strategy was selected to keep operating systems intact and in a hope of a fast exit from the COVID crisis. The large share of in-house capacities stimulated activity levels but fortunately did not depress independents much. Significant production cuts were managed through cutting production in selected assets. Oil companies completed broad optimization of flows from producing wells. The preliminary assessment of the cuts suggested that companies will have issues restoring production levels to pre-COVID levels. In other words, a combination of high drilling rates and reducing flows of existing wells did not create excess capacity that can be used to increase production fast.
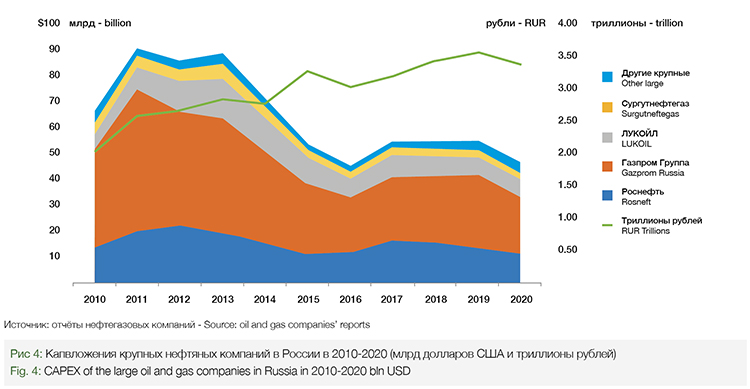
In 2021 footage declined moderately due to adjustments by several oil companies to keep CAPEX under control. Footage cuts were small compared to the US/Canada’s declines of 2020. In the second half of 2021, LUKOIL and Gazprom Neft started to talk about the need to increase footage significantly to meet the production targets in 2022 and beyond. Gazprom Neft announced ambitious plans to push production to 130 million tons of oil equivalent in 2025. Calls for higher activity levels support the suggestion that Russia’s excess capacity is limited. New drilling will be required to increase and then maintain the output. Low elasticity will ensure steady market growth in local currency with occasional devaluation shocks.
Summary for Russian OFS: inelastic to oil price (upside), require increased activity levels (upside), devaluation is key to managing competitiveness of oil production (downside), low profitability (downside).
The Middle East OFS market also demonstrated a low elasticity to oil prices. This regional market grew fast in 2010-2014 amid high oil prices but noticeably continued the slow expansion in 2015-2019 regardless of the oil price movements. Low elasticity is related to two major factors: oil production capacity expansion and active drilling for gas. These stories are connected but focused on resolving different issues. The largest OPEC members in the region decided to increase their so-called Maxim Supply Capacity (ability to produce oil at this rate for one-two year). Saudi Arabia announced a 15 million barrels a day target by 2027-2030. UAE set its target at 5 mmbd by the same period. Kuwait also planned a significant increase in maximum supply capacity. Targets to increase MSC by these three counties in the region aim at 5-7 mmbd of additional capacity (250-350 million tons per annum) to their existing annual production. Plus, Iraq with significant, prolific reserves and major expansion plans. Iraq accounted for 113 million tons of additional production from 258 added between 2010 and 2019. And, of course, Iran with high-quality reserves and crippling sanctions on oil exports from 2019. This region’s oil, in most cases, is developed from highly prolific onshore and offshore fields. This means that, although they are very expensive to develop, these assets do not require high OFS activity to maintain their production levels. Moreover, key regional players may reduce their targets for peak capacity (as Saudi Arabia did) and depress local OFS activity. These reductions hit local and international OFS companies, in the region, hard in 2020-2021.
The natural gas development strategy in the Middle East, on the other hand, focuses on boosting export potential and on resolving domestic energy shortcomings. Qatar initiated a major capacity upgrade of its LNG trains and will serve global markets. Other countries focused on developing gas for replacing oil (again increasing export capacity) and use it for domestic energy production. Interestingly, gas projects in Saudi Arabia involve the development of shale resources.
Summary for OFS in the Middle East: inelastic to oil price in the last decade with a potential for increased elasticity (downside), require increased activity levels particularly in gas (upside), high profitability (upside).
The individual elasticity of OFS activity levels compared to the oil price defines the future development of the OFS markets. Russia’s OFS market will remain inelastic and will not change much in its upward movement amid the declining quality of the reserves and inadequate investment to achieve efficiency gains. The key differential from the other two regions is the devaluations of the Rouble that negatively impact domestic and international OFS companies. The Middle East was inelastic until 2019 with governments building up oil production capacity and developing natural gas capabilities. However, commitment to capacity build-up may dry out and the elasticity may grow (which will be still constraint by the predominance of types of projects that are heavy on upfront costs and long lead-times). The US industry, despite pledges, will remain elastic but in constantly changing conditions. The US shale revolution challenged the conventional wisdom that higher production (and market share) requires higher activity levels (investment). Operators in the US managed to improve recovery amid constantly lowering costs. The oil price decline in 2015 did not stop but sped up the optimization processes delivering ongoing technological shifts. These trends placed traditional global suppliers in a precarious position forcing them to choose between production levels and oil price. The COVID crisis exacerbated the issue, but since 2016 it was clear that the growth in shale efficiency amid high oil prices will dominate the global oil industry for years to come.
The present balance achieved through OPEC+ is fragile and will require careful balancing of the interests of the group in the future. High oil prices at the beginning of 2022 present opportunities for the US/Canada region to capture market share even though its average OFS costs are much higher. Balancing the triangle of these key regions may require a significant reduction in oil prices in the medium term after a short period of high oil prices supported by the OPEC+ agreement.
The Russian OFS industry shall withstand almost any development in the global oil industry. Ironically, the high oil price in the long-term presents more threats to the industry than moderate price levels. High oil prices will require constraints on production levels which will depress activity. Low production levels will limit exploration, involvement of new unconventional reserves, and interest in upgrading the technology and equipment. The above will negatively impact Russia’s ability to monetize reserves in the long term. Moderate prices will require increased discipline and continuous OFS efficiency improvement. There is much to be learned from both the Middle East’s investment in the capacity build-up and the US/Canada’s ability to involve traditionally uneconomical reserves amid continuous improvement in drilling and completion efficiencies. Focused investments in new OFS technology and equipment will increase the Russian oil and gas global competitiveness in the long run. The industry then will be better prepared to withstand future tumultuous conditions such as COVID and inevitable periods of intense price competition.
Dmitry Lebedev,
REnergyCO


