Rosneft: Enhancing Oil Production in Mature Fields Through the Use of Mud Logging in Horizontal Wells
R. R. Minikeev, OOO “Petroviser”
D. E. Golubkov, OAO “NK Rosneft”
Introduction
The main aim of the oil industry, at present, is to increase operational efficiency and increase production in mature fields. One way to achieve this is to drill lateral and horizontal wells and to combine this with the interpretation of the geophysical and geotechnical data.
The idea of using the mud gas data while drilling, in order to detect the hydrocarbon saturation of the borehole, was first suggested in 1933 by V. A. Sokolov and M. V. Abramovich. Gas chromatography was introduced by V. A. Sokolov, A. M. Turkeltaub and V. A. Zhukovitsky in 1951-1955. GTI then appeared in the 1960’s, and was an attempt to expand the geochemical surveys through measuring drilling process parameters [1]. At present, GTI data is widely used by many oil companies, including Rosneft, while drilling horizontal wells.
Mud Logging
Mud logging enables the evaluation of the level of hydrocarbon saturation of the formations by comparing the various hydrocarbons in the mud with the existing background levels.
In order to be more effective when interpreting the GTI mud logging results, it is necessary to use the data in respect of both depth and time. The availability of the source data in the time aspect makes it possible to monitor the depth aspect and therefore analyse the gas indications post-drilling. So, you would use the information in the depth aspect when drilling the hole, and use the information on the time aspect when:
» mud logging data post-drilling (diffusion log);
» associating the gas anomaly with a specific depth interval after hole enlargement, reaming, adding lengths, mud-return breaks, during clean-up;
» analysis of the lost circulation and fluid kicks [2].
Geotechnical surveys, telemetry surveys using azimuthal logging methods, and synthetic logs are the bases for making intelligent decisions when drilling lateral and horizontal wells. Evaluating the reservoir’s productivity during drilling is based on, above all else, the mud logging results. There are a number of factors that affect the amount of gas observed at the wellhead. These are as follows:
» type and properties of the drilling fluids and additives;
» geological conditions within the survey area;
» drilling technology specifics;
» composition and quality of gas analysis equipment.
Let’s discuss the possibilities of using the GTI log data while drilling in the Soviet era field. The operating company was OAO “Tomskneft” VNK.
The field is situated in the Tomsk and Tyumen oblasts, it was discovered in 1962 and came on stream in 1966. Most of the original oil in place is contained in the pay zone AB1. In terms of its geological structure, the field is complex, which is due to its multiple formations and the macro heterogeneity of the pay zone structure. In the upper section of the AB1 productive formation, high shale content was identified with textural features that are commonly called “hazel grouse” in the Russian oil patch. This increases the degree of heterogeneity of the oil bearing part of the reservoirs and deteriorates the whole hydrodynamic drive processes.
One of the main sources of information obtained while drilling horizontal and lateral wells in this Soviet era field is GTI velocity & mud logging. The assessment was carried out for pay formations with good poroperm properties, which were selected on the basis of velocity logging and compulsory geological surveys (such as mud description and analysis, calcimetry, luminescent-bituminological analysis, porosity and density analysis, gas content). The following were used during the assessment:
» residual gas saturation factor (Fgas) for gas bearing formations, residual hydrocarbon saturation factor (Fhc) for hydrocarbon bearing formations;
» base triangle methods;
» fluid coefficient methods;
» Pixler charts;
» RAG diagrams, etc. [3]
The following methods of fluid coefficients were used in the study: From June 2013 to June 2014, GTI data for 20 wells from the Soviet era field were analysed using the “PS KiUSS” software package (developed by OOO “Petroviser”).
During the interpretation, the following basic international fluid coefficient methods were used:
» OPUS3 (composite indicator of hydrocarbon composition, version 3);
» X-log (Wh, Bh, Ch);
» Pixler ratios (С1/С2, С1/С3, С1/С4, С1/С5) [4, 5].
Generally, line graphs plotted using the first and the last methods (OPUS3 and Pixler’s) help determine the the gas-oil contact (GOC) and the entry into the formation and give a more accurate representation of the fluid type (gas / gas condensate / oil condensate / oil / water), while the x-log diagrams provide us with a more generic picture of the fluid segregation between gas and oil. The interpretation results make it possible to:
» detect the entry into the target interval;
» perform further well placement (Fig. 1);
» assess the degree of hydrocarbon saturation of the formations;
» perform correlation with the data acquired from other logging types;
» identify commercial hydrocarbon deposits.

Interpreting the geophysical logging data in order to forecast the GOC and WOC locations presents a problem. However, by comparing the well placement data (Fig. 1) and the results of interpretation of mud logging while drilling using “PS KiUSS” (Fig. 2), we can identify the entry into the pay formation, determine the saturation behaviour and the possible presence of commercial deposits. In Fig. 2 we can clearly see the increase of C1-C3 gases in the bottom graph and the rise of the Wh line in the x-log method of the middle graph from the 1945-m depth, the saturation has changed from the gas one to the oil one. When drilling the hole in the “hazel grouse” shale interlayers (in Fig. 1 these are 2060-2120 m and 2180-2250 m depths), gas indications drop in these intervals (Fig. 2).

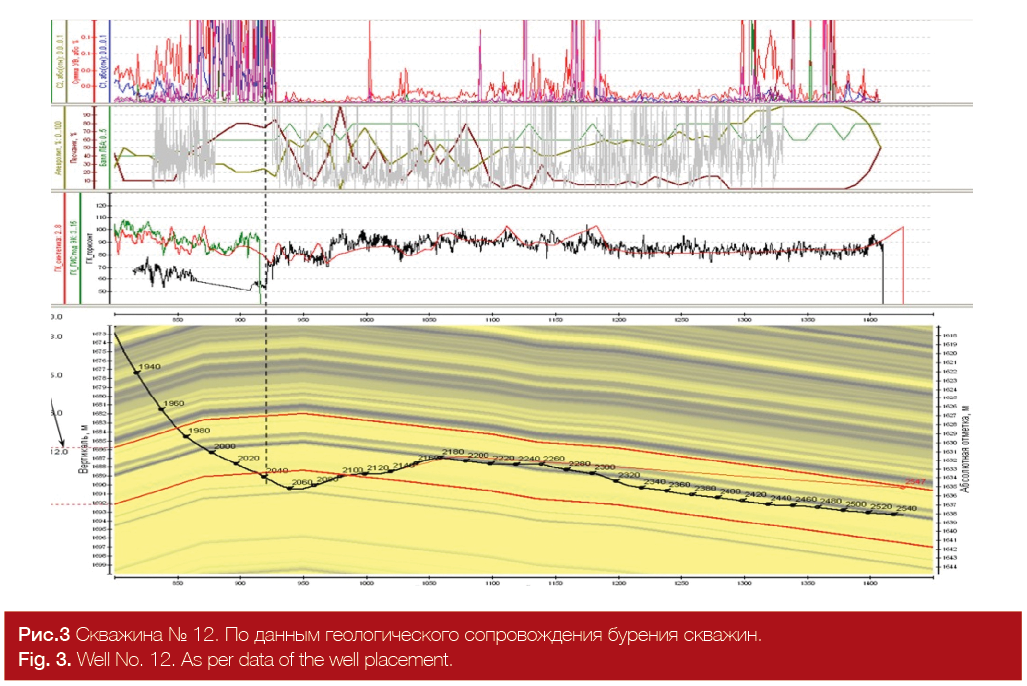
Fig. 3 shows the placement of the horizontal hole of Well No. 12, and Fig. 4 shows the interpretation of GTI mud logging for the same well. It can be seen that there’s a clear match between the GTI data and well placement data (entry into the target at 1970 m measured depth (1683.5 m vertical depth) and exit from the formation within 2040-2100 m measured depth intervals; hole holding in the middle of the target with the best poroperm properties from 2300 m measured depth (1689-1692.5 m vertical depth). The saturation determined by OPUS-3 and х-log methods gives oil, while the Pixler ratios do not provide a clear picture of the saturation behaviour due to the low C2 (ethane) content in the mud while drilling.

Conclusion
The behaviour of the fluids, in the Soviet era field deposits, when they have been determined by conventional geophysical logging (GIS) methods is controversial. The use of the mud logging data and a combined interpretation of GIS and GTI data, honouring all the specifics of the drilling work and field geological structure, increases the effectiveness of the performed survey.
Mud logging interpretation to differentiate gas- and oil-saturated sections in structurally complex reservoirs of the AB1 formations increases the horizontal well placement efficiency and helps increase the rates of production from the Soviet era wells.
References
1. E. E. Lukyanov Geotechnical and geophysical surveys while drilling. – Novosibirsk: ID “Istoricheskoe nasledie Sibiri” (Historical heritage of Siberia), 2009 – 752 pages.
2. E. V. Tarassova, “Operativnaia ocenka nasyshchennosti porod po gazovomu karotazhu” (Real-time assessment of rock saturation using the mud logging results). – Tver: NTV “Karotazhnik”, Issue 10 (208), pages 10-21, 2011.
3. D. E. Golubkov, “Sovershenstvovanie tekhnologiy razrabotki plasta AV1 Sovetskogo mestorozhdeniia dlia effektivnogo promyshlennogo osvoeniya” (Improvement of the Soviet field’s AB1 formation development technologies for effective commercial development). – Moscow: “Territoriya NEFTEGAZ” Magazine, Issue 6, pages 88-90, June 2013.
4. E. E. Lukyanov, New technology of determination of the
saturation behaviour of reservoirs based using the mud logging data. – Tver: NTV “Karotazhnik”, Issue 8, pages 75-104, 2008.
5. E. E. Lukyanov, GTI Data Interpretation. – Novosibirsk: ID “Istoricheskoe nasledie Sibiri” (Historical heritage of Siberia), 2011. – 944 pages.