Rosneft: New Approach to Well Logging Data in Horizontal and Deviated Wells
Horizontal and extended reach drilling has been steadily growing over the last decades. The geological and geophysical data acquired as a result of such drilling has traditionally been used to evaluate the quality of the drilled sediments. The total field and prospect parameters were obtained and calculated based on data from vertical wells.
With the advent of the complete well logging (WL) equipment for horizontal wells, it became possible to assess the quantitative parameters of the well. However the basic curves are primarily used for that purpose, which results in significant errors specifically due to the strong impact of the neighbouring formations on the tool readings in the drilled sediments. Furthermore, modeling for the reserves estimate and subsequent production forecast is generally based on the dimensional analysis algorithms, utilizing both the horizontal and vertical properties. Horizontal well (HW) logging does not actually produce data on vertical properties but, unlike the insignificantly deviated wells logging, it allows us to determine the formations lateral spread and to determine their properties. In case of a vertical well, the properties of the drilled sediments spread uniformly for a considerably large radius (the nearest tens to hundreds meters) from the wellbore in a coaxial-cylindrical manner. They spread in all directions consistent with the formation structure, while the HW properties can only spread laterally along its path as the formation boundary position cannot be determined, even in case of a slight vertical deviation. This problem worsens with an increase in vertical deviation, geological variability and in the complex formations (clinoform, channel, etc.). Given the uncertainty of seismic data on vertical wells, the horizontal well seismic survey data is also a challenge.
Special Aspects of Horizontal Well Logging
The standard reserve estimate methods assume the availability of relevant input parameters, some of which could hardly be determined with significant confidence using the horizontal well logging data. Such parameters in particular include net oil and gas saturated thicknesses.
In case of a non-perpendicular reservoir entry its thickness TST (true stratigraphic thickness) is calculated by the formation penetrated and angle sinus at which the wellbore crosses the formation determined by the LWD imager data.
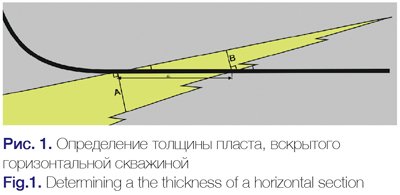
Uncertainty in the evaluation of such an angle grows with the increased penetration of a specific formation (Fig. 1), which leads to uncertainty when trying to determine the thickness. Moreover in case of the variable formation thickness along the wellbore path or if a wellbore crosses the formation top or bottom under different angles, it is unknown whether the thickness А or В (refer to Fig. 1) should be used as an estimate parameter for plotting dimensionally. In addition, if a wellbore crosses only the top or bottom of the formation, the thicknesses cannot be determined in principle. Thus development of the net thickness maps frequently used for reserve estimation using the HW data is impossible.
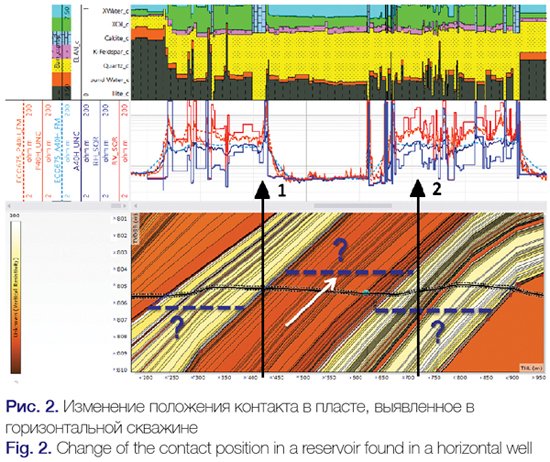
The fluid contacts position also cannot be determined because in case of a single flat contact in a formation the HW will pass parallel to it. On the other hand, since the horizontal wells belong primarily to the production well stock and are drilled at different field development phases, data acquired in a HW enables evaluation of the initial saturation distribution under the capillary phenomena or its change in the course of development. Fig. 2 features an example of the water breakthrough in the middle part of reservoir represented by formation with better reservoir properties while the neighbouring reservoir intervals are not watered – even though they have been affected by development. Such information which changes the perception of the formation fluids behaviour cannot be obtained through logging one vertical well. For instance the well 1 on Fig. 2 will only penetrate the upper reservoir zone, but the well 2 will penetrate all three horizons and that will not allow immediate detection of the formations uneven elevation.
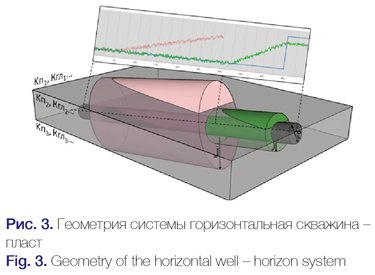
The second source of uncertainty is the inapplicability of the horizon properties quantitative evaluation methods based on the WL data without a special processing. That is because of the wellbore-reservoir system geometry complexity impacting the physical value readings obtained in the course of WL and resulting in unclear logging characteristics of the reservoir boundaries and other cross-section non-uniformities (for instance, consolidated sandstone concretions). As seen on Fig. 3, when a formation is crossed at a shallower angle the logging tool survey field will include several formations and the well itself could be placed partly in one formation and partly in the other. It is impossible to judge which formation will impact the integral tool readings more without information about the geological structure and bedding peculiarities.
The recorded data are significantly impacted by interbedding the particulars of the adjacent formation. Unlike the formation penetrated by a vertical well, in horizontal wells the anisotropy, which in a varying degree is typical to almost all geological differences, is significantly more reflected in the logging data. This is one of the key problems for the fluid content and studied zone dynamic properties forecast. The wellbore wall profile and geometry to a large extent determine the measurement condition adjustments of the WL methods. The key seats, breakouts, hole shoulders and other wellbore geometry complications should be thoroughly detected and controlled by the azimuthal caliper logging and other LWD methods.
All the above factors are affected by the difference of the surveyed rock volume for the logging tools and their individual probes (for the array versions). Readings of the deeper logging tools will characterize the average properties of different formations located in at various distances from the wellbore, and to a smaller extent correspond with same in the wellbore wall proximity. In case of an orthogonal formation crossing the wellbore the lateral variations of the lithological composition and properties of the surveyed sediments within the resolution capability of the entire methods array are, as a rule, negligible. This allows you to compensate for the different method readings for assessment of shaliness, porosity and other formation parameters. In case the geological boundaries position relative to the tool axis is close to parallel, that assumption and accordingly the joint WL data interpretation methods based on that are frequently inapplicable.
In order to obtain adequate formation parameters in a well and its immediate proximity, as well as more accurately determine the geological boundaries, azimuthal logging methods need to be used. This allows us to take into consideration the the 3D spatial distribution of the formations, as well as generating new approaches and software solutions in order to reduce uncertainty.
New Approach to the Horizontal Well Logging Data Application
In recent years the aforementioned problems have been widely discussed and software and methodological approaches to address are being developed. One of those approaches was used in the course of logging the wells with very lengthy horizontal sections drilled offshore off Sakhalin Island. The study zone was the terrigenous sediments of the Nutovo formation. The following software packages were used in the course of work: Petrel (including Geosteering module) and Techlog (module 3D Petrophysics).
The basic principle of this approach is the different scale of data integration (Fig. 4). For example, the general understanding of the producing sediments structure obtained on the basis of seismic data 1 is used for generating the base geological and geophysical model 2. By virtue of that model the wellbore path is designed, and preliminary property forecast is made, before drilling. Once new logging data is acquired while drilling and from the tool memory, corrections are made in the intervals penetrated by the drill, as well as forecasts done for the sections that have not been drilled. The geological body boundaries position is more precisely determined through comparison of the predicted and actually recorded logging data and continuous cross-section along the wellbore path update in the geosteering software 3. Based on results of the acquired data, as well as comprehensive analasys comprehensive analysis a decision could be made on the geological targets, target path and well completion design.
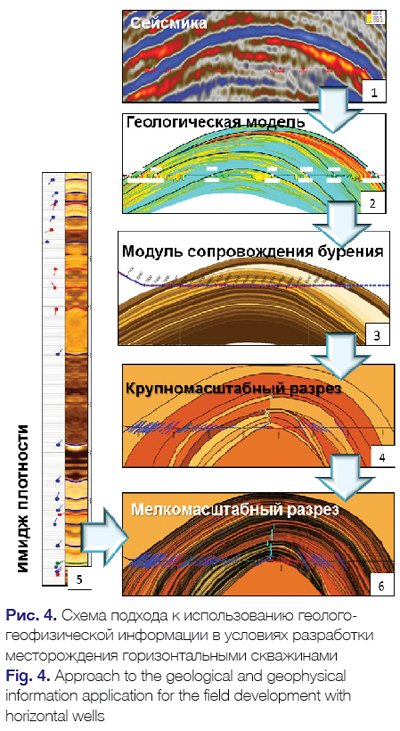
Thus the geological concept is updated during the course of drilling, which is the basis for a large-scale cross-section generation in the software applications utilizing the numerical methods for solution of the direct task for different WL methods in line with particularities of the penetrated sediments bedding 4. Application of special visualization formats enables integration of different types of data such as the cross-section structural models based on seismic data jointly with the geological play boundaries confirmed in the course of the drilling support and LWD imager interpretation results 5 for the small-scale cross-section model generation 6 (refer to Fig. 4). It should be noted that the process is not automated and at this stage all geological boundaries are mapped manually.
The next stage of processing is the creation of a detailed model of geophysical properties by attributing a geophysical parameter (natural radioactivity, density and photoelectric factor, neutron porosity, vertical and horizontal resistivity) to each interlayer and calculating synthetic logging curves using algorithms based on this layered model. The modeling quality is verified by comparison of curves estimated and recorded in a well. The model is corrected to achieve satisfactory convergence by means of an interactive tuning of the property distribution and boundary positions. The geophysical parameter projections on the well path in the form of the step-like curves serve the baseline data for the petrophysical interpretation. In that case, they will reflect the rock properties and be undistorted by the wellbore and neighboring geological plays. Use of the step-like curves, obtained by means of the abovementioned process, allows the justified application of an integral petrophysical interpretation model both for the vertical and horizontal wells.
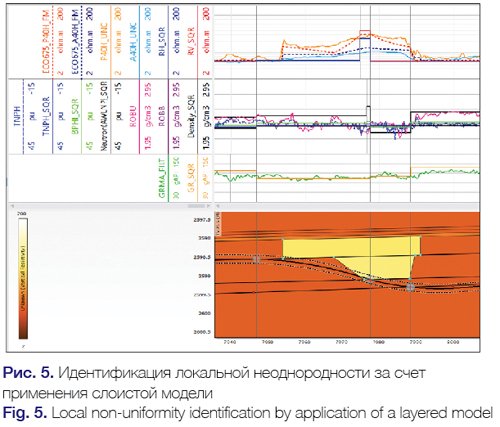
It should be noted that the process requires not only understanding of the behaviour logging curves in line with lithology, porosity and fluid saturation in a well and immediately adjacent area by the interpreting petrophysicist, but also of the wellbore path and geometry particularities. This kind of work is interactive and at all stages shall be conducted in close interaction between a geologist and petrophysicist so that interpretation errors are avoided. Please refer to Figure 5 for an example of efficient use of this technique.
Standard interpretation of unprocessed LWD data assumed the presence of an oil-saturated reservoir, but the results of the well and cross-section visualization, as well as layered model generation allowed us to come to the conclusion conclusion that the presence of tight sandstone with a carbonate cement which elevates readings of the electrical resistivity tools even if it is a not penetrated by well.
Therefore there is a need for a correct layered geological model of the well path, and any information regarding the 3D properties recorded in the well are also important. One of the specific features of LWD tool assembly is the capability of recording the different survey method data in the azimuthal logging mode – spatially aligned arrays of different measurements at a common depth point. In terms of the azimuthal sampling the LWD varies from the high-resolution 64-sector images to quadrants – four base curves directed up, down, right and left relative to the wellbore axis.
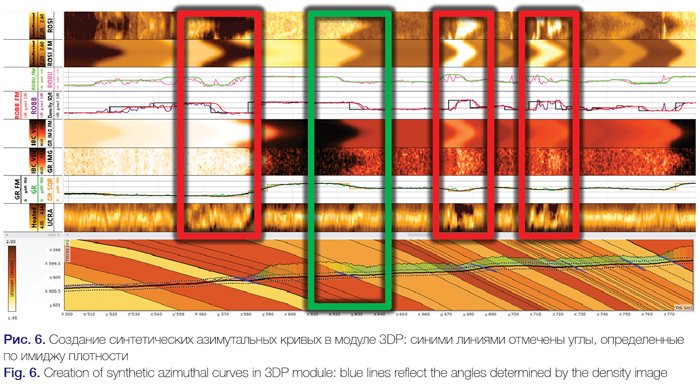
When applying the described approaches associated with the WL direct problem solution by numerical methods there is a possibility of calculating high resolution gamma and density logging images, as well as the four quadrant density log.
This is why, when adjusting the layered model, it is necessary to reduce errors in at least four or more azimuthal curves as the volume density does not reflect the actual change of the drilled section. We must also consider the azimuthal caliper log data (UCRA) because the wellbore diameter and profiel changes. This complicates layered properties of the model.
Unfortunately at this point there is no possibility of producing an image from an automated caliper tool while processing the WL curves. This is why one of the objectives of the interpreter should be to evaluate the welbore condition and select the most credible cross section in the incomplete wellbore. Moreover, the cross section highlighted in green on Fig. 6 shows that the angle determined by the density image is not always credible. This is due to to crossing of the wellbore angle and the adjusting of other geological boundaries.
The layered geophysical model degree of detail which enables us to correct well logging data acquisition for further interpretation, depends on the cross-section properties, geological and petrophysical objectives, WL assembly completeness and should be selected individually for each particular well. On this basis, the common principles and sequence of actions remain constant. The results of the geological and geophysical interpretation, with the application of an optimal activity model along the wellbore path at different stages of its construction, or data re-interpretation should be transferred to the base geological model for the geometrical correction and rock property spatial distribution adjustment based on the horizontal drilling. Integration and synchronization of the different scale geological and geophysical models and close inter-discipline interaction of experts is the key condition for a successful application of the proposed approach and modern and frequently costly equipment usage efficiency improvement.
Conclusions
1. Lack of information concerning the vertical cross-section variability and complex geometry of the wellbore-formation system limits the application of data acquired in the extended reach drilling wells.
2. In order to reduce uncertainty in the horizontal well logging content and interpretation, we should introduce hardware and software packages that record azimuthal measurements and 3D WL problems.
3. The standard approach integrating geological and geophysical information, as well as the interaction between experts, requires us to adjust and adapt to the complex geological conditions when drilling horizontal wells. The latest software and tools can aid this and allow more efficient decision making.
Reference List
1. Inversion-based method for interpretation of logging-while-drilling density measurements acquired in high-angle and horizontal wells / A. Mendoza [et al.] // Geophysics. – 2012. – V. 77(4).
2. K.O. Shmyglya Review of the WL, PWL data problems and its processing and interpretation for the horizontal and dog-legged wellbores // Abstracts for XII applied science conference “Geology and development of fields with hard-to-recover reserves”. – 18–21 September 2012 – Gelendzhik. – P. 60.
3. Petrophysics in high angle and horizontal wells / D. Maggs [et al.]
// GEO ExPro. – 2014. – February. – Р. 60–62.
4. Griffiths R. Well Placement Fundamentals. – Schlumberger, 2009.
References
1. Mendoza A. et al., Inversion-based method for interpretation of logging-while-drilling density measurements acquired in high-angle and horizontal wells, Geophysics, 2012, V. 77(4).
2. Shmyglya K.O., (Overview of problems and features of log data and methods of its processing and interpretation in terms of horizontal and highly deviated wells), Proceedings of XII nauchno-prakticheskaya konferentsiya (Geology and development of deposits with hard to recover reserves), 18-21 September 2012, Gelendzhik, p. 60.
3. Maggs D. et al., Petrophysics in high angle and
horizontal wells, Proceedings of GEO ExPro, February 2014, pp. 60–62.
4. Griffiths R. Well Placement Fundamentals. – Schlumberger, 2009.
The article was published in the ROSNEFT Scientific and Technical Newsletter (Nauchno-technicheskiy Vestnik OAO “NK “Rosneft”) No.3, 2016, pp.32.
Printed with permission from the Editorial Board.
L.D. Eliseyeva (RN-Shelf-Arctic LLC),
G.S. Stunzha, K.O. Shmyglya (RN-Exploration LLC),
А.А. Bovykin (Rosneft PJSC)