Slavneft-Megionneftegaz: Integrated Model Building for the Upper Jurassic J1 Reservoir
Introduction
The key factor in successfully drilling a production well is an accurate geological structure prediction for a producing formation. Currently, new well drilling data often disproves the existing formation models, which undermines the oil and gas reservoir production performance. Local heterogeneity identified through drilling and detailing of the reservoir profile have underlined the need to further analyze the reservoir geology. Formation models, built with seismic data, accurately capture the areal distribution of formation porosity and permeability.
Description of Studied Site
The site is geographically located in the Surgut District and partly in the Nizhevartovsk District of the Tumen Region, of the Khanty-Mansi Autonomous Area. The J1 stratigraphy comprises of the Upper Jurassic (Upper Bathonian-Callovian and Oxfordian) deposits of the Vasyugan Suite. The deposits consist of sandy argillaceous silt with thin coal seams. The microfaunal remains in the deposits are symptomatic of the shallow sea water depositional setting.
The deposits are sheet-like, uplifted with an overlying seal. The upper sub-suite of the Vasyugan Suite includes the J3, J2, and J1 intervals interbedded with claystone sequences.
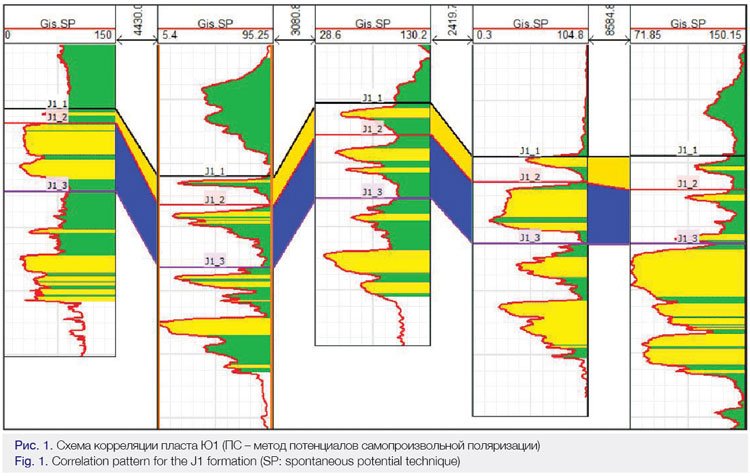
The formations show varying thickness within the identified reservoir boundaries. Erratic depositional patterns in the shallow water created individual sand lenses inconsistent in size. The total formation thickness within the site varies from 53 to 70m. The net J1 and J2 formation thickness is from 2 to 18m with a repeated lateral occurrence of the deposits except for some areas in the northern part. Thickness of the J2 formation reaches 18 m, greatly exceeding the J1 upper sublayer thickness of 1 to 8m (Fig. 1). The reservoir in the J2 sublayer is under development.
The deposits are located in the northern part of the area confined by structural uplift.
An isochron map and slice of the time domain 3-D seismic data volume are shown in Fig. 2.
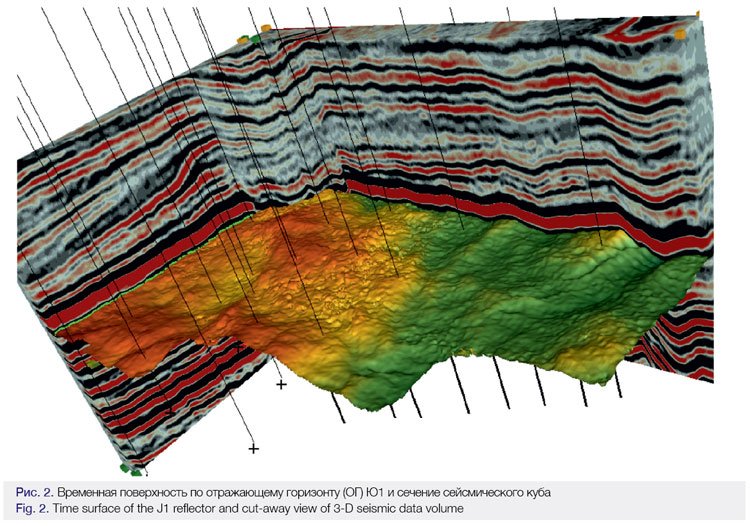
The interpreted depositional history and features of sediment deposition and removal provide an indication of the porosity and permeability distribution across the area. The seismic section shows that, stratigraphically, the J1 reflector is at the top of the J1 upper formation. The reflection corresponding to the top of the J2 formation cannot be isolated since, with waves, it is not possible to detect the geological structures with an approximate thickness of 10m as distinct separate seismic interfaces. The reflection event visible on the seismic section is a composite of the interference between the two formations. Therefore, the net thickness values for these formations can be assumed to be within the resolution limits of seismic survey [1]. The geological parameters of these structures may be predicted only for a combination of the two formations or for the formation having the highest thickness in this area of the reservoir. This article discusses the evaluation of the J2 formation in this field.
J2 Reservoir Geomodelling
To build the formation model, the 3-D seismic data volume obtained in 2006 and re-processed with new software tools in 2017, was used. The goal of the data processing team was to arrive at a sufficiently detailed wave pattern for the Jurassic interval. Another indicator of the data’s processing quality was the preservation of the dynamic range of the seismic recording required to analyze the attributes. Finally, the quality of the resulting volume was adequate to meet the goals set. Following re-processing, the seismic section has varying reflection amplitudes. Wave amplitudes depend on rock acoustics, thus the amplitude analysis tells us about the geology of a site. A multidimensional approach including an in-depth analysis of well information was used to study the lateral change in amplitudes. The V. Muromtsev technique [2] was applied to determine the differences in the environment for deposition of the formations from the shape of the SP curve. To build a single structural model, it was necessary to extract the common patterns in the depositional systems using the seismic and well data. Through its holistic analysis, it was possible to identify stages in the reservoir depositional evolution, different genesis regions, and local features within the prospective structures. A nearly east-west oriented, elongated short-lived watercourse channel was indicated as the most prospective area for hosting hydrocarbon clusters.
The seismic study included computation of amplitude maps for the reflector interval, isochore maps, seismic facies maps, and other attributes of the seismic signal. The first step in the amplitude analysis sought to explain property dispersion for the entire study area based on one seismic attribute. The next step was to describe the stages of reservoir deposition and attempt to clarify the causes behind the failed estimation from one of the amplitude maps. The seismic attribute maps showed lateral zoning patterns. The seismic facies map showed more distinct zone locations with structural separation aligned along a nearly north-south direction. Facies zones have different geological composition. Zones in the seismic facies map were geologically classified with the facies distinguished in the proximal, distal, and axial bar ends. The bar system formed at a certain point in time was further eroded and partly re-deposited by waves.
Facies change westward from the proximal to axial and distal bar end. There are only the distal bar portions featuring a lower thickness, porosity, and permeability in the western part.
Similar zoning is observed in the time slices at ±10 ms from the J1 reflector. Their analysis suggests that reservoir deposition was a multi-stage process.
The seismic volume was sliced along the J1 reflector into a similar 2 ms layers within a ±14 ms time window. They show amplitude distribution at some point in time. The shifting zoning characteristics distinguishable above and below the reflector are interpreted by the authors as the J2 lens layers. This zoning continues further, and the basin gradually accommodates sediments. The 10 ms slice shows sediments deposited in the western part of the reservoir with its boundary flexing down southward. At a later stage, the northeast part of the reservoir extending in a nearly north-south direction is deposited. In the authors’ view, the shifting coastal line attributes to such zoning and is a critical factor in determining reservoir characteristics. Based on this zoning for dividing reservoir deposition into stages, the attribute-amplitude maps by slices were converted into the net thickness maps. The slice below the J1 reflector was used to generate a map of the western reservoir section and the slice above the reflector for its eastern section, finally producing a combined thickness map for the entire site. In this case, the correlation coefficient for the attribute and net thickness was quite high at around 0.7. With a strong correlation between the seismic and geological data, it was possible to create a net thickness map for the entire area. Using the reservoir depositional history approach, change in the formation structural style was described. The formation porosity and permeability calculated for different depositional stages revealed the general pattern of their distribution within the entire reservoir boundaries.
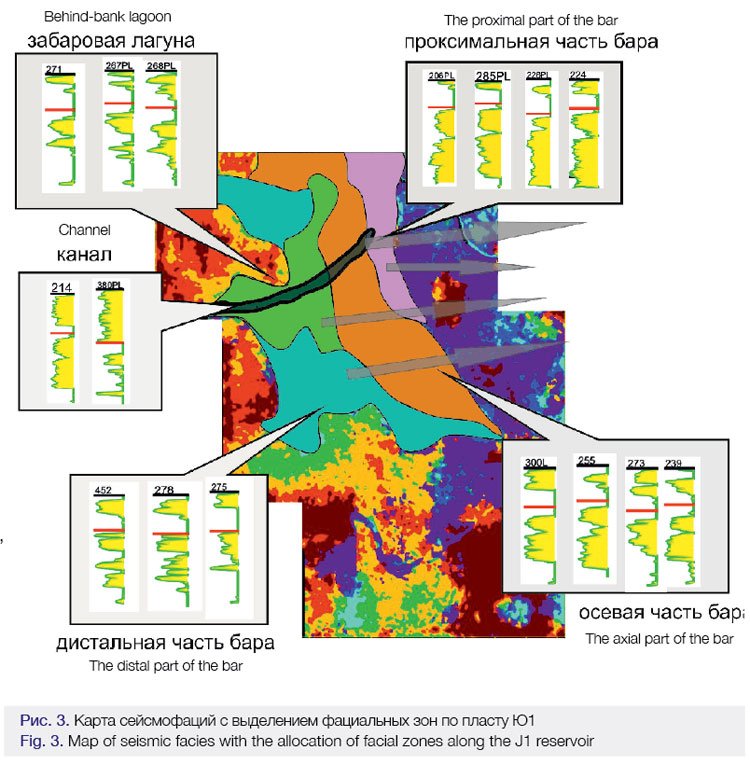
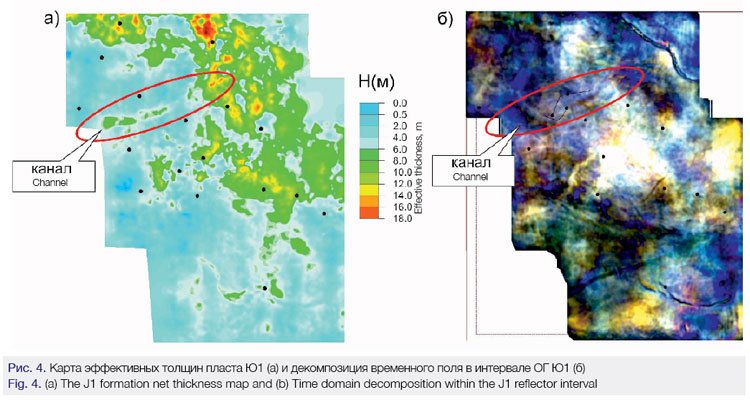
To gain insight into the reservoir depositional evolution, the isochore maps between seismic surfaces portraying lateral heterogeneity and variation in the horizontal structure configuration must be studied. Regions with a lower or higher time thickness that may be associated with variation in the total or net formation thickness are visible in the isochore maps. For instance, a lower thickness area between the B and J1 reflector, which is associated with a higher formation thickness, is distinguishable in the eastern part of the site. Analysis of the amplitude maps suggested that the time thickness anomalies exist in the channel crossing the reservoir from the east to the west. To examine the channel area more closely, the seismic facies maps were computed (refer to Fig. 3) from the analysis of lateral variation in the seismic trace shape. Similarly shaped traces were organized into classes with a boundary between the classes differentiated by a probable change in the structural properties. The seismic facies map for the J1 reflector interval also revealed an anomalous region extending in the direction similar to the direction on the isochore map. If the geological framework, specifically, variation in lithologic characteristics and formation thickness, is assumed to have a critical role in determining the seismic trace shape, the reservoir structure can be characterized as laterally variable in facies with the spatially distributed seismic facies classes. The thickness map (Fig. 4. a) distinctly shows a channel (a narrow area in the central part of the site) trending northeast to southwest. The channel trend is also visible in the spectral decomposition RGB map (Fig. b).
The theoretical underpinning for the channel is detailed in depth in the literature, for example, in [3]. Coasts with the predominant wave conditions for creating tidal channels may have existed, as evidenced by barrier islands.
Lack of any inlets for the shoreward waves to move through caused flooding and barrier breaking during storms. And the structures referred to as alluvial channels and tidal inlets formed. Channels are generally filled with coarse sandstone (with a deposit thickness of around 1 m) overlaid with coarse and medium sand (with a thickness up to 14 m) with sand coarseness decreasing upward the section to the fine sand formed at the bay’s edge. The channel is short-lived and may move along the coast or remain in place depending on the wave pattern. The performed analysis appears to have discovered the channel of such genesis in the field of interest. Seismic data were successfully applied to identify the major structures in the reservoir and prospective development areas.
Conclusion
The newly identified geologic structure and improved information about the porosity and permeability distribution across the main production target in the J1 formation resulted in a decision to revise the drilling strategy within the channel area by switching to selective development and creating a new reservoir pressure maintenance (RPM) system based on the distribution of reservoir characteristics.
In view of a local geological structure in form of a narrow channel about 7 km long and 400 to 600 m wide, it was decided to site horizontal wells transversely to the channel with a 500 m spacing. To prevent early water breakthrough from the RPM system, the injection wells were evenly distributed in the channel area, considering the well pattern in the main site. Net oil pay penetrated by the wells in the channel much exceeded net oil pay in the main drilling site.
It led to drilling the single bore horizontal well and multi-stage hydraulic fracturing rather than, as is conventional in this field, drilling the multi-bore wells. The realized results supported the reasonableness of the decisions made. Oil production was 77% above target.
A multidimensional approach to the deposit analysis provided an understanding of its structure and areal distribution of the formation porosity and permeability. The depositional history approach proved highly efficient for numerically estimating geological parameters for this field. Factual insight into the geological structure of the prospective areas was pivotal to the successful drilling of the horizontal wells in the field.
References
1. Seismic Stratigraphy/ P.R. Vail, A.P. Gregory, R. M. Mitchum, R. Sheriff/edited by Charles Payton. – Moscow: Mir, 1982. – 375 p.
2. Muromtsev V.S. Electrometric geology of sand bodies – lithological traps of oil and gas. – Moscow: Nedra, 1984 – 258 p.
3. Baraboshkin E.O. Practical sedimentology (terrigenous reservoir).- Tomsk: Publ. of TPU, 2007. – 154 p.
Authors:
M.A. Kuznetsov, D.A. Prunov
(JSC Slavneft-Megionneftegaz)
R.N. Asmandiyarov, O.E. Kurmanov, V.G. Miroshkin, A.A. Dudzinskaya, L.A. Guryevskikh, A.A. Shpindler, A.V. Roshchin, M.A. Slepukhin
Gazprom Neft Science and Technology Center (Gazprom Neft NTC LLC)
Published with thanks to Gazprom Neft & PROneft Magazine