SSC: Predicting and Preventing Drill String Fatigue Failure

This article describes the results of an analytical study of drill string fatigue failure, prediction, and prevention during well construction.
Regarding the causes of drill string failure, the API Recommended Practice 7G, para. 13.2.1 states:
Most failures of drill pipe result from some form of metal fatigue. A fatigue which originates as a result of repeated or fluctuating stresses with maximum values less than the tensile strength of the material. Fatigue fractures are progressive, beginning as minute cracks that grow under the action of fluctuating stress. The rate of propagation is related to the applied loads and under certain conditions may be extremely rapid. The failure does not normally exhibit extensive plastic deformation and is therefore difficult to detect. There is no accepted means of inspecting which will determine the amount of cumulative fatigue damage or the remaining life in the pipe at a given stress level.
The presently accepted means of inspection are limited to the location of cracks, pits, and other surface marks: measurements of the remaining wall thickness; measurement of the outside diameter; and the calculation of the remaining cross sectional area.
Recent industry statistics confirm that a major percentage of pipe failures occur near the upset run-out or within the slip area. Special attention to these critical failure areas should be performed during inspection to facilitate crack detection in drill strings which have been subjected to abnormally high bending stresses. Drill pipe which has just been inspected and found to be crack free may develop cracks after very short additional service through the additional damage to previously cumulative fatigue damage.
The accumulation of fatigue damage is due to the reversed variations of the stresses, such as those induced when the drill string rotates in a curved section of a wellbore. The development of fatigue is further accelerated through combined tension and torsion loading.
The accumulation of fatigue damage leads to the initiation and growth of microcracks in the drill pipe body, subsequent wall erosion, and washout. If the washed-out drill string is not tripped out at the right time, the drilling mud will induce intensive wall erosion eventually resulting in failure.
Now let us look at the mechanism of fatigue microcracking in more detail.
Microcrack Fatigue Development in Drill Pipe
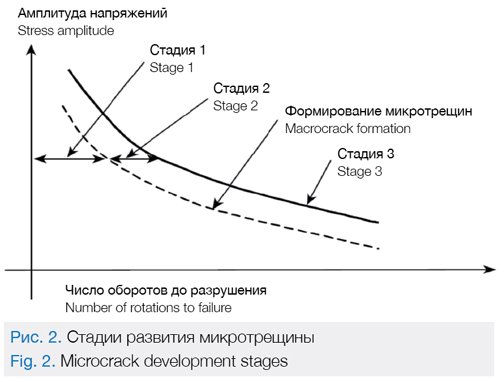
Microcrack fatigue formation and propagation life in the drill pipe is described in detail in the Fatigue of Drill string: State of the Art (Oil & Gas Science and Technology – Rev. IFP, Vol. 57 (2002), No. 1, pp. 7-37)1. It can be roughly divided into 3 stages (Fig. 2):
In Stage 1, when the drill string is rotated, due to the reverse cyclic stresses microscopic cracks appear near the surface (А1, Fig. 1).
In Stage 2, the microcracks extend into the pipe body perpendicular to the applied stress, and the crack
growth rate correlates to the stress level (А2, Fig. 1).

The microcrack growth rates are higher at the high stress concentration areas such as the threaded connections, the upset area between the tool joint and the pipe body, the area where the slips or tongs grip the pipe, or the internal drill pipe surface is affected by corrosion pitting (a localized form of corrosion creating pit cavities).
Microcrack growth rates are also influenced by liquids present in the fluids, in the form of water, drilling mud or any other material. When the drill pipe rotates in a curved section of the wellbore, the microcrack constantly opens and closes passing through the short and long radius curvature. When the microcrack opens, the vacuum in it draws the liquid from the fluid on the same principle as a pump. Half-way through the cycle the microcrack closes and the liquid is trapped inside under pressure inducing further damaging effects.
In Stage 3, propagation of microscopic cracks further inside the pipe body leads to failure. When the crack penetrates the entire drill pipe body thickness (А2 = S, Fig. 1), the drilling mud flow is forced inside under pressure. The drilling mud starts rapidly washing out the pipe body and within a few minutes may result in a drill string failure.
Microcrack formation and propagation at stage 1 and 2 takes up to 80% of its life cycle before it can be identified by state-of-the-art defect detection methods, depending on the metal type and equipment sensitivity. Progressing microcrack growth in the drill pipe body causes either a brittle fracture or a plastic deformation.
Since it is not practical to detect fatigue microcracks initiation by means of early non-destructive testing, the capability to determine the likelihood of development and predict the cumulative fatigue wear of the drill string, based on drilling process information and well characteristics, becomes of crucial importance.
The methods used in drilling to estimate drill pipe use, such as drilled meters, circulation hours or other physical indicators, do not provide a correct analysis of the current condition. This is due to the fact that they fail to fully consider the pipe’s operating conditions down hole. In order to estimate the drill string condition more reliably, we need a method which considers the complete spectrum of factors that influence the rate of fatigue damage growth in the pipe body.
A1 : Initial microcrack depth; A2 : Final microcrack depth;
S : Drill pipe wall thickness; σ : Tensile stress direction
Estimation of Cumulative Fatigue Wear in the Drill String
The method developed by the specialists, of the Drilling Department in the Siberian Service Company, is an effective way of estimating the cumulative fatigue wear in the drill string during well construction, based on wellbore path and drilling process.
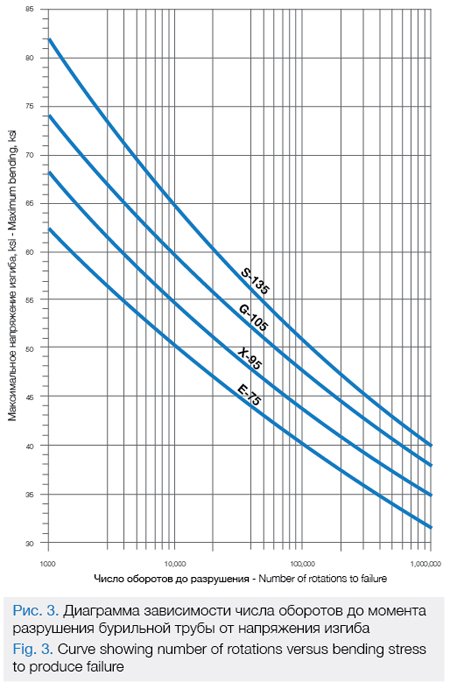
According to the API Recommended Practice 7G and IADC Drilling Manual , the Wöhler (S-N) curve showing the relationship between the bending stress and number of the stress cycles to the drill pipe failure should be used to assess the cumulative fatigue damage in the drill string.
By knowing the bending stress applied to a specific point along the drill string, it is possible to determine the maximum number of rotations to drill pipe failure. Since the maximum number of rotations depends on the bending stress applied at any point in time, cumulative fatigue damage is not expressed as an absolute value but given as a percentage of total drill pipe service life (100%). The IADC Drilling Manual recommends that the amount of cumulative fatigue wear in the drill string be defined in a simple equation:
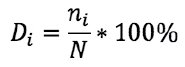
Where
Di : Cumulative fatigue wear
ni : Actual number of cycles at a specific bending stress
N : Maximum number of cycles at a specific bending stress
The actual number of cycles (ni) at a specific bending stress is calculated by means of the following equation:
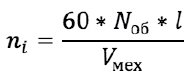
Where
Nоб : Rotary speed, RPM
Vмех : Drilling rate, meters/hour
l : Length of the interval drilled, meters
The maximum number of cycles at a specific bending stress (N) is determined by means of the Wöhler (S-N) curve using the equation:
![]()
Where
σиз : Bending stress, kpsi
σр : Tension stress, kpsi
N : Maximum number of cycles at specific bending stress
a, b : Constants based on the drill sizes, steel grade, and corrosiveness of the drilling mud
To calculate the bending and tension stress applied to the drill string, we use the Drill String Design Manual by VNIITNeft.
Evaluation Model for Cumulative Fatigue Damage in the Drill String
Using the above equations, we have developed an evaluation model for cumulative drill string fatigue damage. The following is used as the calculation basis:
• Actual directional survey data (the wellbore depth, inclination angle, drift angle, dogleg severity)
• The drill string size (length and diameter of the pipe body, wall thickness of the pipe body, length and diameter of the tool joints, strength grade)
• The level of the current drill pipe wear as classified by API (new, premium, class 1)
• The drilling mud density
• Drilling process within an interval (rotary speed per minute, drilling rate)
When the calculation basis has been uploaded, the evaluation model simulates the wellbore drilling process interval by interval. It then calculates the values of the stress imposed at any point in the drill string and cumulative fatigue wear.
The evaluation model developed to analyze load levels and calculate cumulative fatigue wear when drilling was used in the construction of well N with 3 drill pipe washout events.
Case Study of Cumulative Fatigue Damage Estimation in the Drilling String for Well N
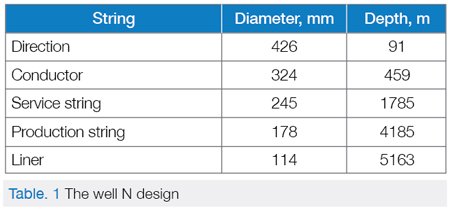
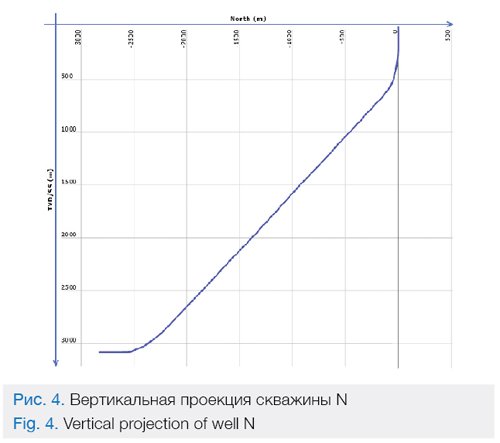
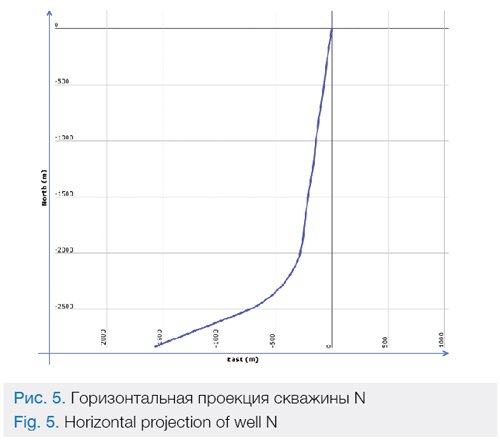
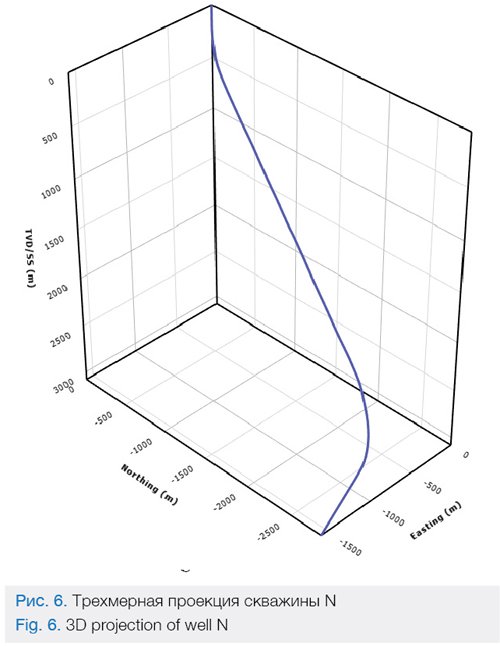
Well N design is shown in Table 1. The well is horizontal with a wellbore depth of 5,163 m and horizontal section length of 978 m.
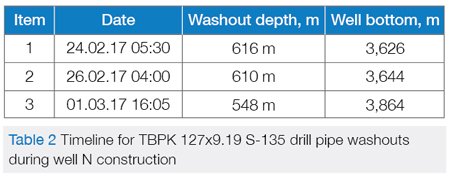
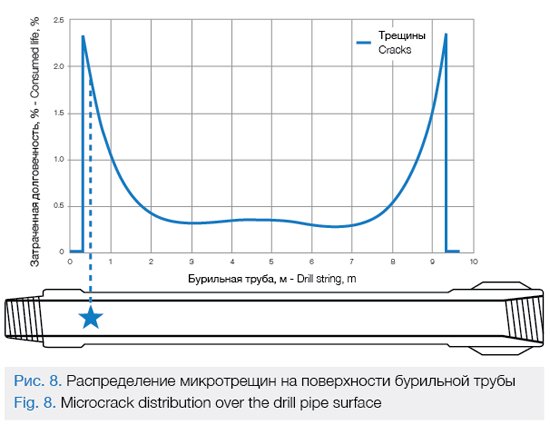
A problem occurred at a depth of 3,835 m during the production string drilling operations in the well, which required a cement plug and isolating the wellbore at the 3,622 to 3,835 m interval. Then at 05:30 AM, on 02/24/2017, when kicking off the cement plug, the pressure dropped due to a TBPK 127х9.19 S-135 drill pipe washout. During well construction there were three drill pipe washouts (Fig. 7).

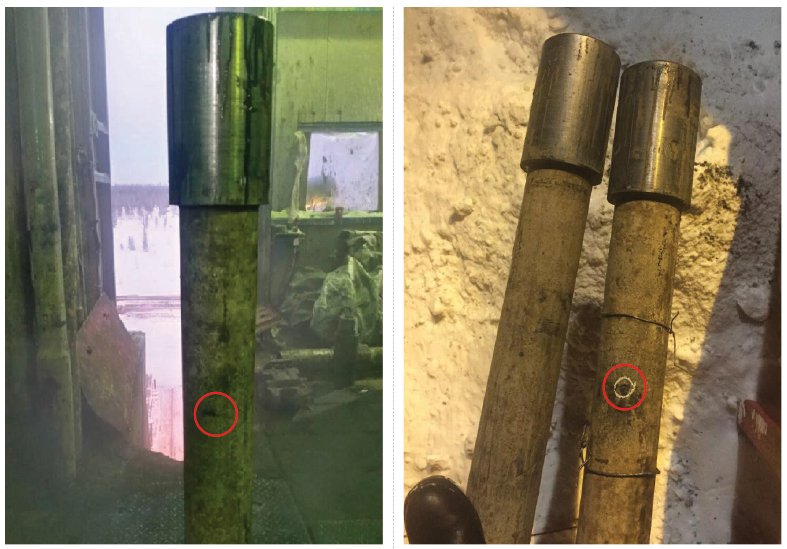
All 3 washout events occurred in the pipe body at a distance of 0.3 to 0.4 m from the tool joint (collar) at the upset area. Such coincidental occurrence is explained by the highest susceptibility of the upset area. It is here that the stresses applied to the drill string are concentrated, thus the rate of microcracking is higher (Fig. 8). The upset area at the collar is additionally damaged by slips or other drill pipe handling equipment. Any scratch or notch on the pipe surface automatically becomes a stress concentration point and accelerates fatigue crack development in this area.
To analyze the causes of the events, the calculation basis for the drilling process and well path was uploaded to the model, in order to estimate cumulative fatigue wear for 2 time periods:
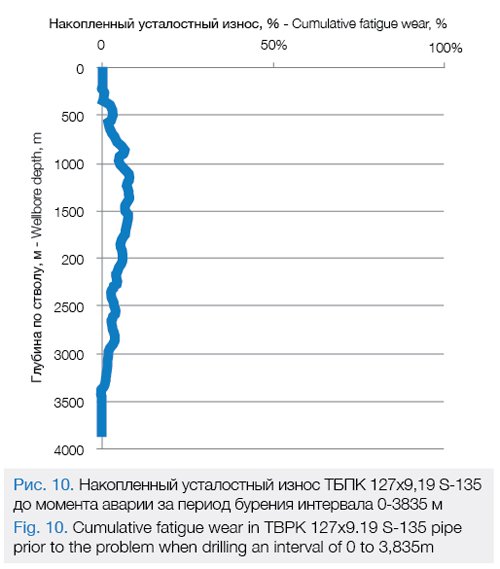
1 Cumulative fatigue wear in the TBPK 127х9.19 S-135 pipe prior to the problem when drilling an interval of 0 to 3,835 m (Fig. 10)
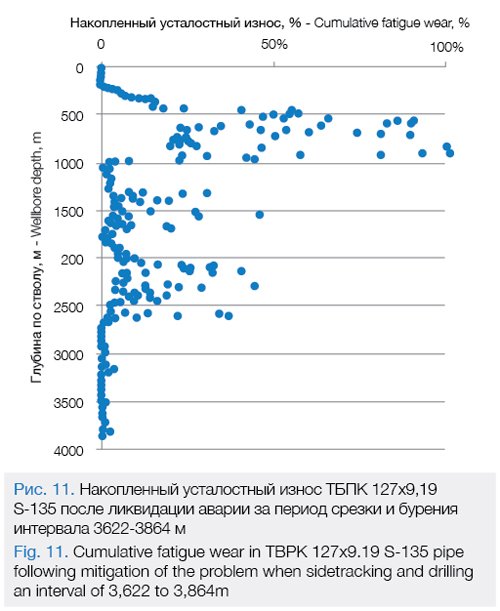
2 Cumulative fatigue wear in the TBPK 127х9.19 S-135 pipe following mitigation of the problem when sidetracking and drilling an interval of 3,622 to 3,864m (Fig. 11)
Cumulative Fatigue Wear in the TBPK 127х9.19 S-135 Pipe Prior to the Problem when Drilling an Interval of 0 to 3,835m
Cumulative fatigue wear when reaching a depth of 3,835m is on average 4% (Fig. 10). However, it is unevenly distributed among the pipes within the set. This is due to great differences in the values of bending and tension stress applied to the drill- string at any point within the well path depending on dogleg severity and BHA weight.
Considering routine operations and a minor error, we can assume for the purposes of calculation that the drill string was tripped down the hole in the same sequence during the surface casing, conductor, service string and production string drilling.
For example, the wellbore within an interval of 0 to 200m is nearly vertical with an average dogleg severity not exceeding 0.04 °/10m. The pipes are subject to maximum tension stress caused by BHA weight down the wellbore. However, since the drill string rotates within a vertical section, it is hardly impacted by any bending stress, and fatigue wear develops slowly.
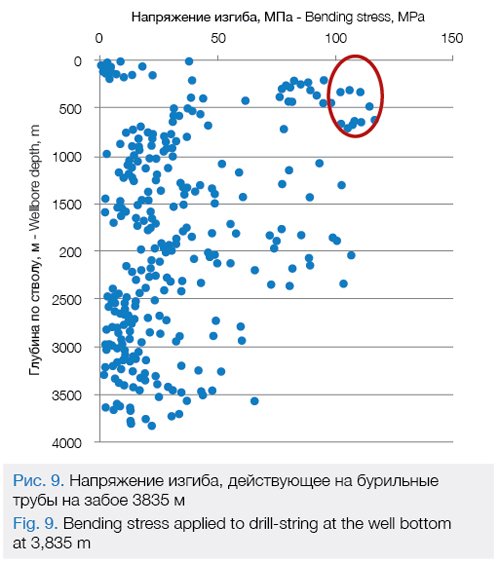
On the other hand, the cumulative fatigue wear within an interval of 900 to 1,600m is 6 to 8%. This drill string passed through a dogleg interval (200 to 700m) with a maximum severity of 1.67 °/10m and a high bending stress up to 116 MPa (Fig. 9) resulting in a higher rate of fatigue damage growth.
Based on a separate comparative analysis, the cumulative fatigue wear when drilling well N within an interval of 0 to 3,835 m is slightly above the cumulative fatigue wear level for similar wells at this site and neither critical nor significant with regard to the remaining life of the drill pipe set used. Given this rate of fatigue development, the drill string would be rejected due to mechanical (tool joint or pipe body abrasion) rather than fatigue wear.
Cumulative Fatigue Wear in the TBPK 127х9.19 S-135 Pipe Following Mitigation of the Problem when Sidetracking and Drilling an Interval of 3,622 to 3,864m
Cumulative fatigue wear in the pipe set following mitigation of the problem when reaching the well bottom at 3,864 m is on average 11% (Fig. 11) but for some drill pipes more than 70%.
In this case we have not included cumulative fatigue wear prior to the problem since considering a BHA replacement to drill out the cement plugs, there is little assurance that the drill pipes were tripped down the hole in the same sequence or within the identical interval as in the previous trip.
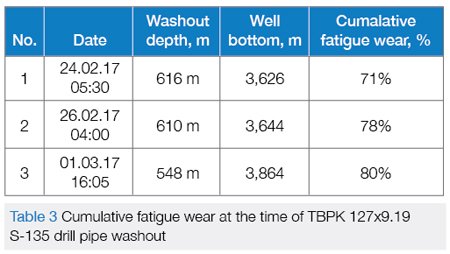
Cumulative fatigue wear for the rejected drill string at the time of washout for each event is shown in Table 3.
Let us now analyze the causes behind the high rate of fatigue wear growth when sidetracking and drilling an interval of 3,622 to 3,864m using event 1 as an example.
Based on the estimation model, we can calculate the tension and bending stress applied to the drill string at the time of event 1 within an interval of 300 to 700 m (Table 4).
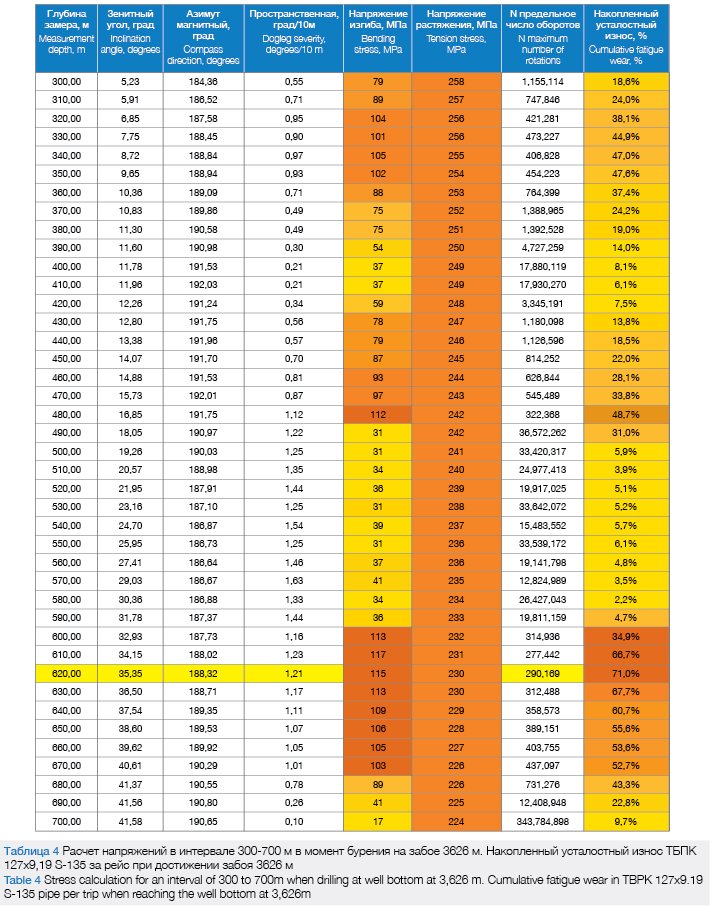
Maximum bending stress (more than 100 MPa) is imposed upon the drill string within the intervals of 310 to 350m, 470 to 480m, and 590 to 680m. When passing through these particular intervals, the drill string develops the most fatigue damage. The longer the drill string rotates within the high bending stress intervals, the faster fatigue wear grows and the higher the risk of pipe body failure.
Drill string washout occurred at a depth of 616m (interval is shown in yellow). This corresponds to a bending stress of 115 MPa. For the size and strength grade of TBPK 127х9.19 S-135 drill pipe used at a bending stress of 115 MPa, the estimated number of rotations to failure from the Wöhler curve is 290,169. This corresponds to approximately 40 h of continuous rotor spinning at a speed of 120 RMP.
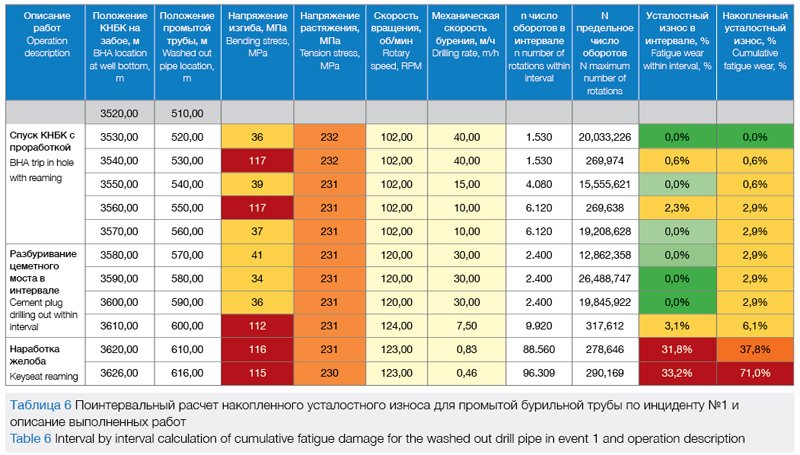
The rejected drill string was rotated within an interval of 510 to 616m during the entire trip. An interval by interval calculation of cumulative fatigue wear is shown in Table 6.
Operation Timeline Prior to Tripping the Washed Out Drill Pipe Out of the Hole Due to Event 1
Before keyseat reaming to kick off the cement plug, the washed out string was already rotated within an interval of 510 to 600m and developed 6% fatigue wear (Table 6). When reaming the keyseat within an interval of 3,618 to 3,624m until the pressure drop from 00:00 on 02/23/2017 to 5:30 AM on 02/24/17, the drill string passed through an interval of 608 to 616 m, developing an addition 65% fatigue wear after 184,869 rotations.
The prolonged drill string rotation within a high bending stress interval led to a high rate of fatigue wear development of up to 71% of its total life during this single trip only.
Since no information is available about the drill pipe’s position in the BHA when constructing the previous wells, a calculation of the cumulative fatigue wear prior to the problem mitigation is not practical. However, by knowing the use of the pipe set prior to well N construction, which is 32,534m drilled, it is possible to estimate approximately the cumulative fatigue wear for normal drilling.
Based on a peer review opinion, the average cumulative fatigue wear for a similar configuration when drilling a 4,000m deep well on this site is about 4%. Thus, the cumulative fatigue wear for the pipe set prior to mitigation of the problem can be assumed to be
It seems, therefore, to suggest that total cumulative fatigue wear for the drill string at the time of event 1 can be
![]()
This means a full wear-out of TBPK 127х9.19 S-135 drill pipe during mitigation of the problem.
Subsequent pipe washout event 2 and 3 confirm the findings for event 1; with the washout cause being the breaking cumulative fatigue wear in the drill pipe.
Conclusion
A clear picture of the nature of the cumulative fatigue wear resulting in drill pipe washouts will allow us to manage this process and reduce or eliminate such events. Measures to prevent washouts and increase overall drill pipe life should be aimed at relieving stress applied to the string and its duration:
1 Individual monitoring and recording of all drill pipe rotation hours using RFID technology to registering the drilling process and cumulative fatigue wear;
2 Well path optimization by reducing dogleg severity within the intervals with the most stress;
3 Selection of the best drill string configuration based on failure stress by using an application specific software;
4 Improving the strength properties of the drill string used;
5 Decreasing the number of the drill string rotation cycles by shifting the rotations directly to the drill bit;
6 Using an internal coating to protect the drill pipe body from exposure to the drilling mud; the internal coating forms a barrier against liquid ingress inside the microcrack thus diminishing its growth rate.
References
Drill String Design Manual – VNIITNeft, 1997
Recommended Practice for Drill String Design and Operating Limits (API Recommended Practice 7G, sixteenth w) – American Petroleum Institute, 1998
IADC Drilling Manual (v.11) – International Association of Drilling Contractors, 2000
Advanced Assessment of Drill-Pipe Fatigue and Application to Critical Well Engineering – Sathuvalli U.B., Payne M.L., Pattillo P.D., 2005
Fatigue Testing and Development of Drill Pipe to Tool Joint Connections – Bachman W.S., 1951
A Method for the Investigation of Fatigue Strength in Seamless Drill Pipe – Morgan R.P., Roblin M.J., 1969
Fatigue Testing of Drill Pipe – Grondin G.Y., Kulak G.L., 1991
Fatigue of Drill string: State of the Art – Vaisberg O., Vincké O., Perrin G., Sarda J.P, Faÿ J.B., 2002
Oleg Fomin: Siberian Service Company (SSC)