TNNC: How Well Spacing Patterns Affect Production After Fracturing
D.R. Gilmiev, Ph.D., A.P. Kovalenko, Ph.D. (TNNC LLC)
Introduction
When designing and planning zonal stimulation activity program for oil reservoirs with hydraulic fracturing, one of the problems is the proper selection of wells for fracking. This issue was covered in several studies [1-3]. Among these, study one [1], based on a model of the static filtration of the reservoir fluids, analysed the fracture’s influence with non-limited conductivity in regards to the well’s production with three -, five – and nine – well spacing patterns; it also showed that the ultimate production can be achieved when all the wells undergo fracturing. The study [2] also covered the impact of hydraulic fracturing on the well productivity in various periodic waterflood systems. The stationary reservoir fluid filtration model was used as the object of the study; presence of fracture was simulated by the introduction of a certain equivalent well parameters. The conclusion obtained and independent of the development system, was that the greatest flowrate is obtained when only the injection wells are hydraulically fractured.
The study [3] analysed the process of measuring oil movement in a 3 well spacing pattern whilest hydraulically fracturing the producing wells. It established that the presence of fractures in producing wells of first order can lead to their premature flooding under certain operating conditions.
Research on technical efficiency of three row well development system
A brief overview of the studies shows some fundamental differences in the results and conclusions. In addition, the studies mainly focused on stationary flow of reservoir fluids and they analysed only the wells production. However, how to control a fractures length and identify well candidate selection for fracturing based only on the recovery factor and depletion rates remains unclear, in conditions of non-stationary, multiphase flow.
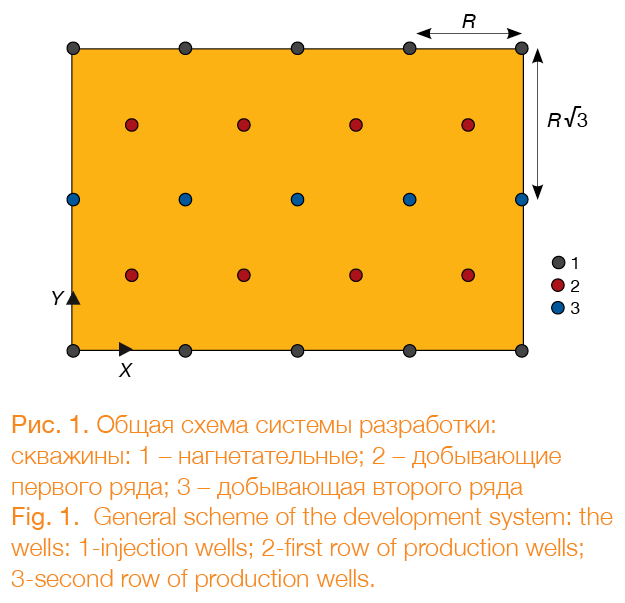
The following case was studied: development system, based on a three-row well spacing pattern, consisting of two rows of injection and three rows of producing wells (Fig. 1). Two-phase model with similar features are used as a study object. It is supposed that the fractures are oriented as parallel to the rows of the producing wells. This model is not limited to individual elements of symmetry, because it is planned to investigate the effects of non-homogeneity and other factors in the future.
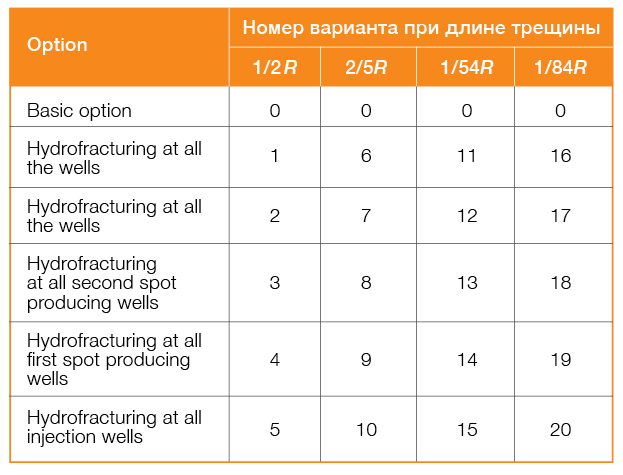
In total 20 options are considered: they are different due to the fracture location in the rows of producing and injection wells and change in their lengths (please, see the table); the distance in-between wells remains constant.
Flow models have the following pre-set parameters:
• Two-phase (oil and water) 3D model of the reservoir, 81 × 65 × 4 cells.
• Depth – 2000 m.
• Cell dimensions: 25 × 25 × 0.5 m.
• Distance between wells R = 500 m.
• Porosity-0.15.
• Sand content-1.
• Permeability-0.1 µm2.
• Initial conditions:
– pressure-20 MPa;
– water saturation-0.5.
• Parameters of fractures, resulted from hydrofracturing:
– fracture opening-10 mm;
– fracture permeability-90 µm2;
– fracture length Lf=1/2R=250 M, Lf=2/5R=200 M, Lf=1/4R=125 M, Lf=1/8R=63 M.
• Fracture orientation parallel to the producing rows.
• Producing wells are operated with water-oil interface control (WOI) (10 MPa).
• Injection wells are operated with WOI control (30 MPa).
Calculations are made on the basis of developed mathematical model-[4]; validation of the numerical algorithm with known analytical and numerical solutions is presented in the [5] study and it is implemented as the FluxSim [6] software.
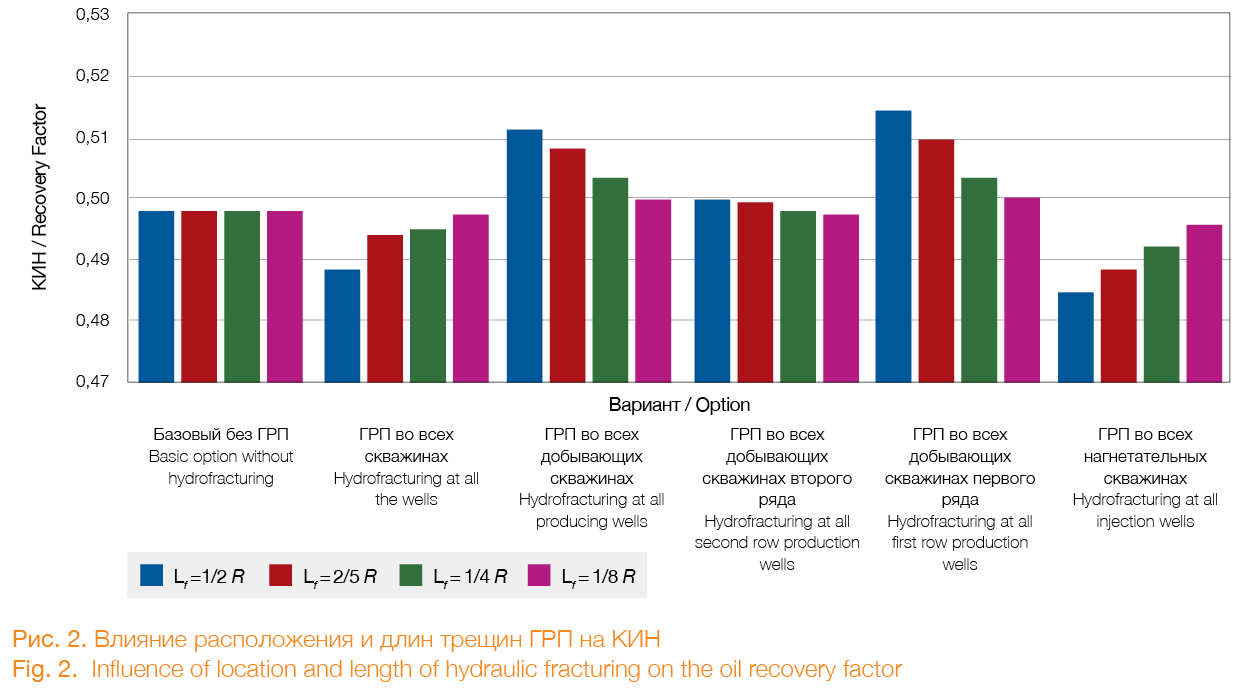
Calculations with use of models showed that the production wells with hydrofracturing are characterized by the greatest accumulated oil production. This option does not stipulate a fast advancement of displaced water from the injection wells to the second row wells, unlike the option with hydrofracturing at the second row wells. The hydrofracturing in the second row production wells result in significantly reduced reservoir pressure between the first and second rows of the production wells and the water is moving rapidly to the second row wells, leading to premature flooding in the first row of wells (Fig. 2).
Figure 3 shows that the hydraulic fracturing option for the first row wells is characterized by the highest recovery factor, however, the oil depletion rates are higher in case with hydraulic fracturing option for the second row wells, compared to the first option. In this case, reaching 97% well flooding shall be a reason for the abandonment.
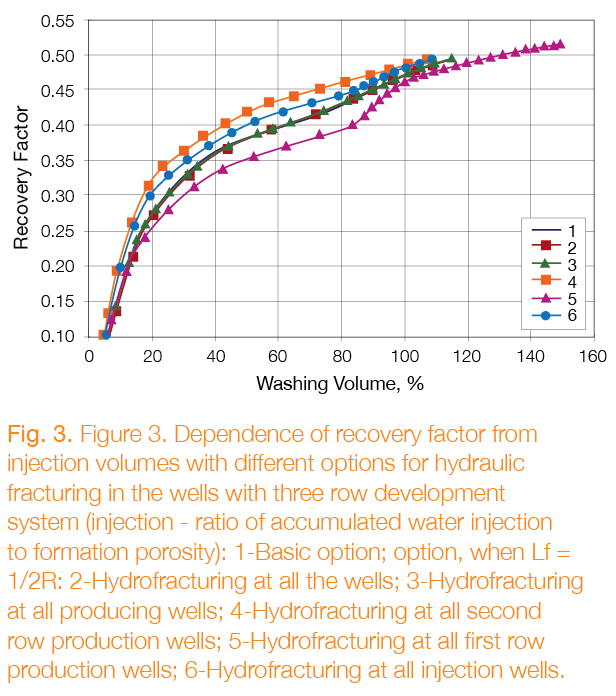
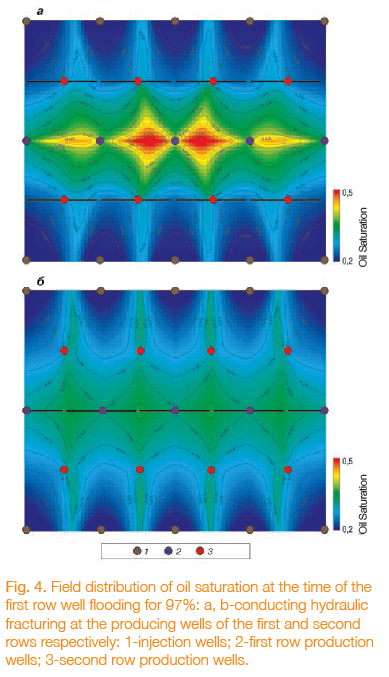
Figure 4 shows the field distribution of oil saturation for the options with hydraulic fracturing at the time, when the first row wells are flooded at 97%. The oil saturation distribution maps demonstrate that in case of hydraulic fracturing at the second row of production wells (Fig. 4,б), the displacement interface moves faster than in case of hydrofracturing at the first row production wells (Fig. 4, а); however, there are more non-developed reserves of oil in the area of the first row wells.
Conclusion
Therefore, the highest total oil recovery factor is achieved in case of hydraulic fracturing at the first row production wells; the best oil depletion rates are shown in case of hydraulic fracturing at the second row of production wells.
If the focus is on the highest recovery rates, in practice the option with hydraulic fracturing at the second row production wells are the most efficient, compared to other options practically with all the injection area volumes (Fig. 3), with the exception of injecting more than 110%. Large flooding volumes correspond to remote periods, when the production is less profitable from an economic viewpoint (considering the discounting) than during the initial periods. In view of the fact that the duration of the real impact of hydraulic fracturing on the fields is typically only 1-4 year [7], the option of hydraulic fracturing at the second row production wells is the best both in terms of volumes of oil production and of the pace of its depletion.
References
1. Murzenko V.V. Analytical Solutions for Problems of Steady Fluid Flow in Reservoirs with Hydrofractures. Nwesletter of Russia’s Academy of Sciences. Fluid Dynamics, 1994, no. 2, pp. 214-220.
2. Kanevskaya R.D., Kats R.M., Evaluating Hydraulic Fracturing Effectiveness Under Different Flooding Systems. Oil Industry, 1998, no. 6, pp. 34-37
3. Deriglazov D.N., Pichugin O.N., S.P., Rodionov. Numerical Influence of Hydraulic Fracture Orientation on Flooding Efficiency. Reports of Scientific and Practical Conference «Status, Challenges and Development of Oil Industry in the XXI century». Tyumen: Published by SibNIINP, 2000, Part 1, pp. 134-142
4. Gilmiev D.R., Hydrodynamic Model of Fluid Filtration in Reservoir with Well Fracture. Oil Industry, 2013, no. 7, pp. 108-110
5. Gilmiev, D.R. Modelling the Heat& Mass Transfer in s System: Oil Reservoir- Hydrofractures-Wells: Thesis of Candidate of Physical And Mathematical Science, Tyumen, 2013.
6. Certificate of state registration for FluxSim software, no. 2012618782, 26.09.2012.
7. Economides M.J. et al., Pushing the limits of hydraulic fracturing in Russia, Paper SPE 90357 presented at the SPE Annual Technical Conference and Exhibition held in Houston, 26-29 September, 2004.
The article was published in the ROSNEFT Scientific and Technical Newsletter (Nauchno-technicheskiy Vestnik OAO “NK “Rosneft”) No.1, 2015, pp.40.
Printed with permission from the Editorial Board.


